Quick Take
- Ai2 launched Theorizer in Asta and released code for the tool, which proposes explanations based on scientific papers.
- Testing a rejected AI hypothesis helped International Potato Center researchers trace Peru’s extreme dew-point estimates to areas far from stations.
- The original November spike remains unexplained, and researchers are seeking independent weather-station observations to check their reconstruction.


Researchers filling a gap in Peru’s climate record had already spotted implausible dew-point estimates when an AI tool suggested a seasonal explanation. The researchers ruled it out for the affected area. Testing it led them to check how the historical data estimated conditions far from weather stations. Ai2 described the case on Nov. 19, when it launched Theorizer on its Asta research platform and released the tool’s source code.
Piero Palacios and Henry Juarez of the International Potato Center were working with PISCO, a dataset that uses weather-station observations to estimate climate conditions across a grid. Its record of dew point, an indicator of moisture in the air, ended in 2016. Filling the gap would give agricultural models an input they use to estimate how much water crops need.
PISCO’s daily minimum temperature record continued through 2020. The team used the years covered by both records to work out how minimum temperature and dew point varied together, then used that relationship to estimate dew points for 2017 through 2020. Ai2 reported that some reconstructed dew points topped 35°C, implausibly high for the affected areas, and that the extremes clustered in November.
What the station comparison showed
Theorizer searches scientific papers and links its proposed explanations to the studies it draws on. It suggested that humidity rose as the Amazon shifted from its dry season to its wet season. The researchers tested that explanation and ruled it out for the affected area.
That test prompted a second question. Would the extremes be more common in parts of the grid with less support from weather stations? The researchers found the extreme reconstructed values outside the area where station observations constrain the historical estimates. Values above the same threshold were already more common in the historical estimates over the periods the team compared. The cause of the original November spike remains open.
Where the reconstructed dew-point extremes appeared
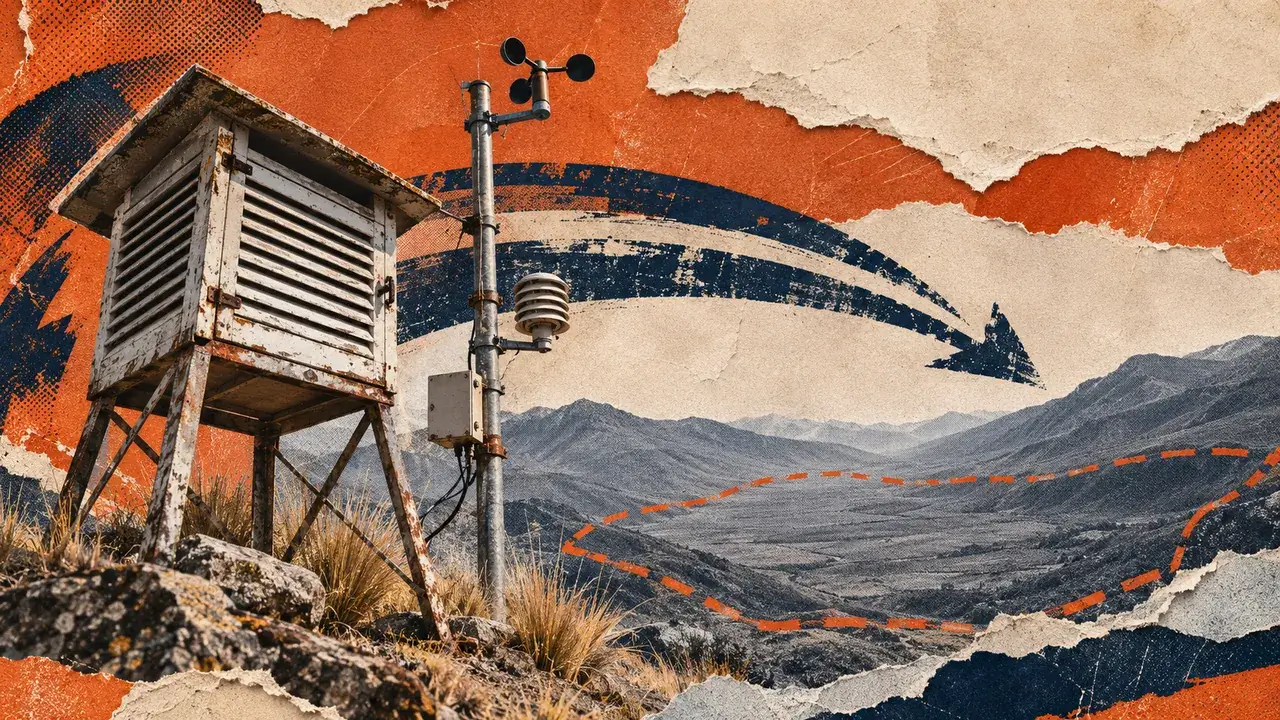
In the International Potato Center’s draft, the extreme values appear outside the part of the PISCO grid constrained by weather stations.
The historical PISCO grid also showed extremes in areas far from weather stations.
The draft’s quantitative findings await expert sign-off. Independent station validation is pending and the cause of the historical November spike remains unresolved.
Sources and evidence
Sources
Supporting facts
- Reported statement Ai2 reports that Theorizer proposed a rise in humidity as the Amazon shifted from dry to wet conditions and that the researchers ruled this explanation out for the affected area. [1] [2]
- Reported statement The researchers told Ai2 that the hypothesis prompted them to compare the November spike in the historical gridded record by distance from weather stations. [1]
- Reported statement The researchers’ draft traces the extreme reconstructed dew points to a part of the historical PISCO grid where the dataset estimates conditions far from weather stations. Extreme values above the same threshold were more common in the source grid during the comparison period. [2]
- Reported statement The researchers’ methods paper is a draft that flags quantitative results for expert sign-off. Ai2 says the team is seeking independent station observations to validate its reconstruction. [1] [2]
- Reported statement The researchers say the cause of the original November spike in PISCO’s historical dew-point record remains unresolved. [1] [2]
Method
Conceptual grid based on the distinction between station-constrained and extrapolated areas described in the methods draft. Markers illustrate the reported pattern without representing a count, a distance or a location.
Scope
The draft’s quantitative findings await expert sign-off. Independent station validation is pending and the cause of the historical November spike remains unresolved.
 CryptoSlate
Ai2 says the researchers are seeking independent weather-station observations to check how well the reconstructed dew points match conditions on the ground.
Editorial credits