

Quick Take
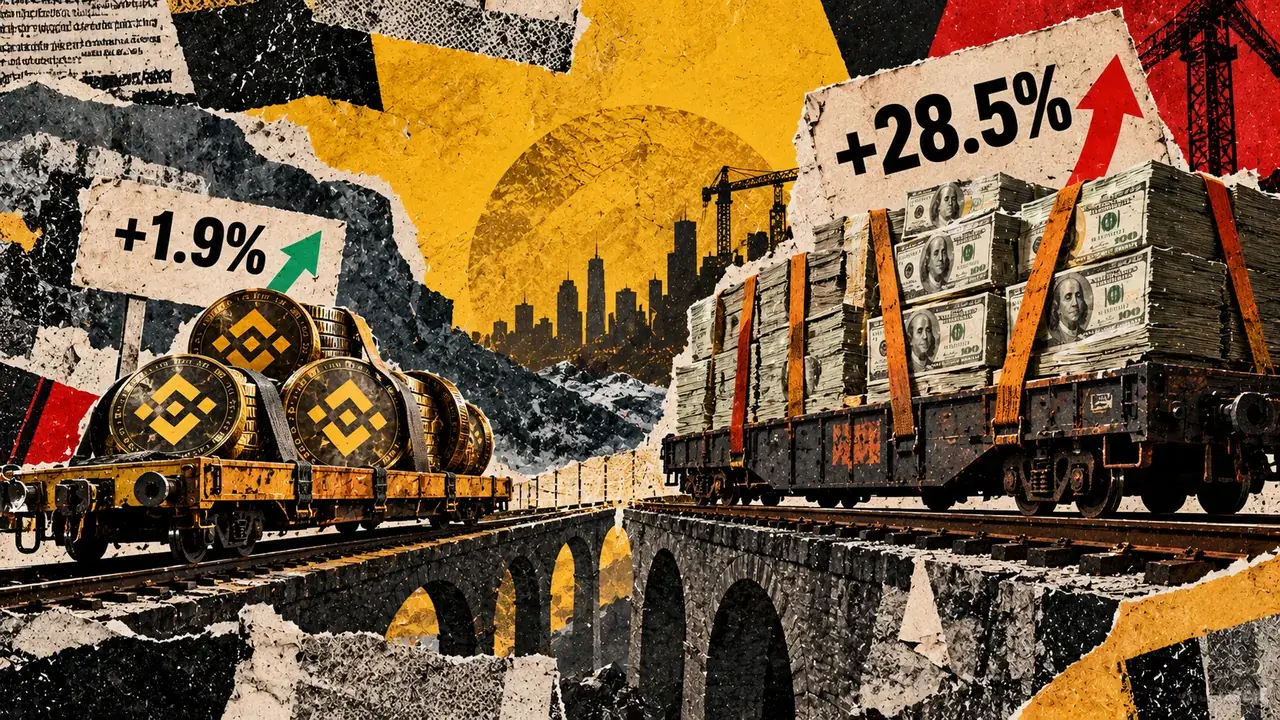
- BNB’s Oct. 19 burn retired 1.9% more tokens than July’s, while its disclosed dollar valuation rose 28.5%.
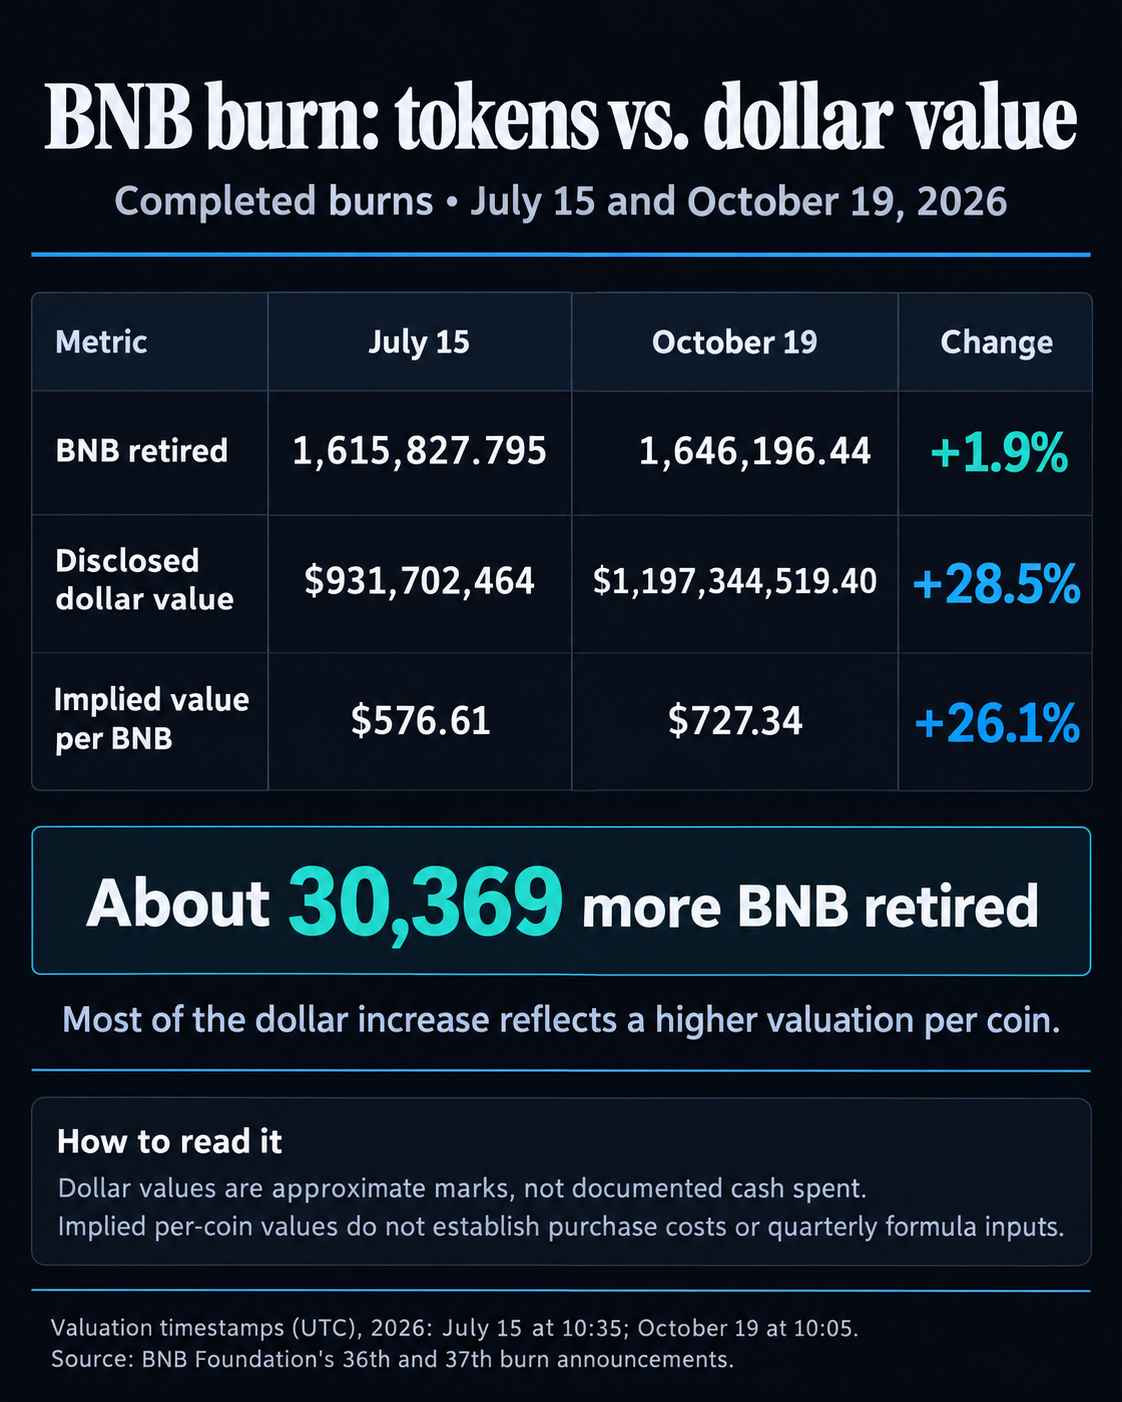
- Implied valuation per BNB rose about 26.1%, explaining most of the gap between token-count growth and dollar-value growth.
- The disclosures do not establish fresh purchases or changes in actively traded supply.


BNB’s Oct. 19 quarterly burn retired 1.9% more tokens than July’s, while its disclosed dollar valuation rose 28.5%. The additional supply reduction was about 30,369 BNB, a much smaller change than the dollar comparison alone suggests.
BNB Foundation announced the completed 37th burn on Oct. 19, reporting 1,646,196.44 BNB destroyed with an approximate value of $1.197 billion. Its July 15 disclosure reported burning 1,615,827.795 BNB, valued at about $931.7 million.
For holders assessing scarcity, the token count measures the size of each retirement.
Why the dollar value grew much faster
The two disclosures show a modest increase in the number of coins removed, along with a much higher implied valuation per coin. The comparison below uses each announcement’s published figures.
| Measure | July 15, 2026 | Oct. 19, 2026 | Change |
|---|---|---|---|
| BNB burned | 1,615,827.795 BNB | 1,646,196.44 BNB | +1.9% |
| Approximate disclosed dollar value | $931,702,464 | $1,197,344,519.40 | +28.5% |
| Implied valuation per BNB | $576.61 | $727.34 | +26.1% |
Dividing each disclosed dollar total by its token amount produces the implied per-coin figures in the table. Most of the roughly $265.6 million increase in the dollar label therefore reflects the higher valuation attached to each BNB. The token quantity rose by 30,368.645 BNB, based on the published amounts.
A quarterly price measure helps determine how much BNB is scheduled for retirement, while the announcement assigns a dollar value to the amount actually burned. A higher valuation at that second step can enlarge the dollar label without a similar increase in tokens.
Those ratios are not evidence of the price paid to acquire the burned coins, and also do not establish the quarterly price inputs used to determine Auto-Burn. A value assigned around execution and a price measure sampled across a quarter answer different questions.
Quarterly Auto-Burn determines a BNB quantity from price and block production on BNB Smart Chain (BSC). Binance’s original December 2021 announcement explicitly made the mechanism independent of revenue generated through BNB on its centralized exchange.
Block production also needs a consistent basis when the network changes speed. BNBBurn’s published methodology converts each block-time era into units equivalent to the original three-second blocks. It discards the fractional remainder from each converted segment before adding the resulting counts.
Shorter block intervals can increase raw block counts over the same elapsed period, so normalization gives the calculation a common basis across those changes.
The tracker describes its price input as a quarterly median, consistent with the original announcement’s sampling footnote. Neither the implied per-coin valuations in the table nor the event totals provide enough information to reconstruct the quarterly calculation or forecast when the supply target will be reached.
What the burn establishes about supply and demand
The quarterly announcements describe sending BNB on BSC to the designated dead address. Neither disclosure provides the acquisition history of the coins used or documents a fresh open-market purchase to fund that event.
A burn transfer records removing tokens from usable supply, while a buyback would require evidence of both the acquisition and the retirement. The dollar valuation attached to the second step cannot supply the missing evidence for the first.
The market effect depends partly on whether the retired coins could realistically have been sold, alongside demand and liquidity. Removing an existing holding can reduce total supply without showing that an equal quantity disappeared from exchange order books that day.
October’s notice reported remaining total supply of 131,512,085 BNB at its writing timestamp and repeated the 100 million BNB Auto-Burn target. It does not quantify the volume immediately available for trading or establish how much short-term selling pressure the burn removed.
BEP-95 is the separate mechanism that connects ongoing BNB destruction to gas fees. Its implemented specification describes burning a validator-governed portion of the fees collected in each BSC block.
The proposal’s initial ratio was 10%, and validators can govern the share destroyed. Comparisons depend on collected fees, the applicable ratio, and the period measured.
Assessing whether fee-funded destruction strengthened between July and October requires comparable windows of gas-fee and BEP-95 burn data, along with the applicable burn ratio.
October’s completed burn delivered about 30,369 BNB of additional retirement compared with July, advancing the stated supply-reduction program. That is the measurable change in this comparison: 1.9% more tokens destroyed, with a 28.5% larger dollar valuation attached to them.

BNB is +1.58% over the past 24 hours and currently sits at rank #4 by market cap.
Mentioned in this article

Editorial credits