

Quick Take
- Bitcoin rose 23.5% in August, while the model projects a slower 4.7% gain by Sep. 29.
- The forecast spans $72,502 to $91,049, signaling substantial volatility around its $81,319 median.
- Bitcoin must reclaim $80,000 as ETF outflows test whether spot demand can sustain the rally.


Bitcoin traded near $77,700 today, Aug. 31, putting the largest crypto asset up about 23.5% over 30 days. CryptoSlate’s market signal registered a bullish 68 out of 100 after a late-week pullback. The score measures trailing market conditions.
CryptoSlate published its latest Bitcoin September forecast at the Aug. 30 close. The model used a $77,667 reference price and produced an $81,319 median for Sep. 29. The projected gain is about 4.7%, compared with Bitcoin’s 23.5% advance during the preceding month.
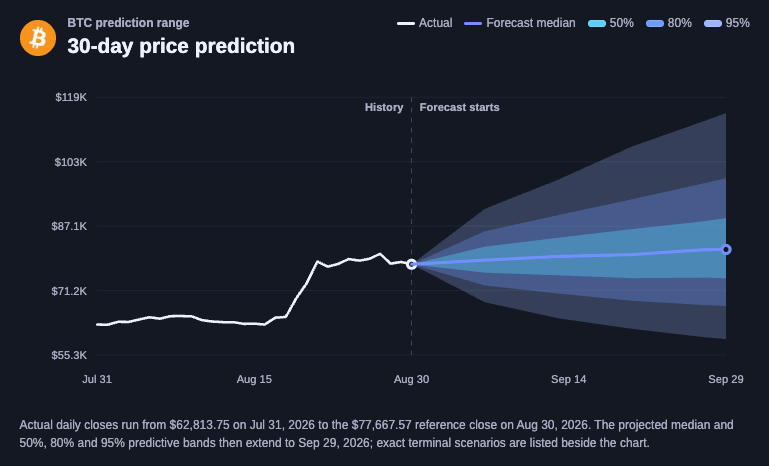
Measured from the reference close, the model’s median adds about $3,651. The central forecast therefore preserves additional upside into late September at a much slower pace after the August rebound.
The model also maps a broad distribution of possible September prices. Its P80 estimate, the 80th-percentile point in that distribution, was $91,049. Its P20 estimate, the 20th-percentile point, was $72,502. The labels identify relative positions in the modeled distribution, with P80 marking the upper estimate and P20 marking the lower estimate.
The $18,547 gap between P20 and P80 quantifies that uncertainty. It covers outcomes on both sides of the reference close and places the median much nearer the middle of the published range.
The distance between the median and those estimates matters after such a fast rally. The distribution’s center points upward, and its wide span preserves substantial volatility around that path.
The late-August move had evidence of spot demand. CryptoSlate’s analysis of the rally cited $2.23 billion of spot Bitcoin ETF demand, an 11% decline in futures open positions measured in Bitcoin and funding near neutral. That combination suggested cash buying supported the advance as speculative leverage cleared.
ETF flows softened at the end of the week. A nine-day US spot Bitcoin ETF inflow streak totaling about $3.04 billion ended with net outflows of $201.9 million on Aug. 28. The reversal ended the clean daily streak. The earlier cumulative inflows still underpin part of the rally.
That shift matters because the preceding inflows were one of the clearest sources of cash demand during the climb.
Price structure supplies the immediate test. Bitcoin’s late-August rejection above $81,000 turned $80,000 back into a near-term reclaim level, and CryptoSlate’s technical analysis placed immediate support around $77,000.
The Bitcoin September forecast arrives with a bullish trailing trend and a central forecast whose projected gain is much smaller than August’s move.
A sustained recovery above $80,000 would strengthen the upside case; a loss of $77,000 would weaken it. ETF flows provide the other near-term signal for the strength of spot demand.

Bitcoin is +0.41% over the past 24 hours and currently sits at rank #1 by market cap.
Mentioned in this article
Editorial credits