

Quick Take
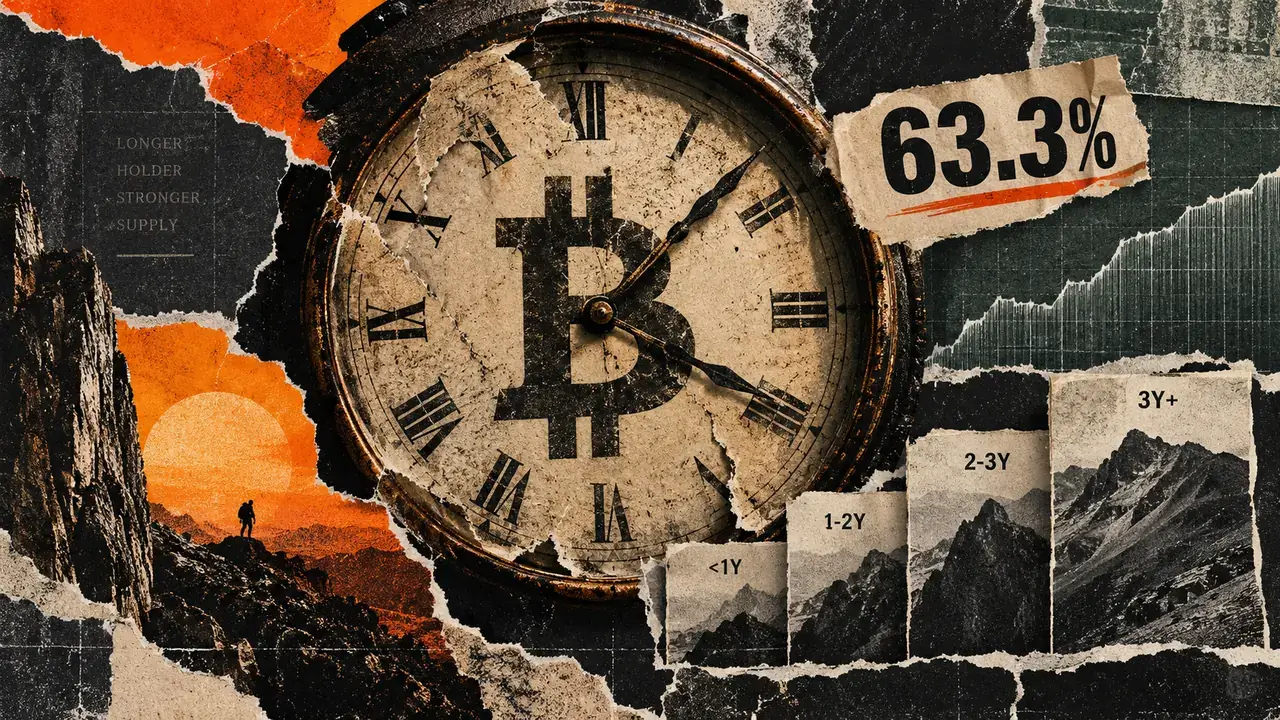
- Bitcoin’s one-year HODL share reached 63.3%, measuring time since coins last moved rather than fresh buying.
- Age-band shifts can reflect coins crossing thresholds, without establishing changes in beneficial ownership.
- Exchange flows and entity-adjusted balances are needed to test whether older supply signals accumulation.


Bitcoin’s share of supply last moved at least one year ago reached 63.3% on Sept. 18, up 0.98 percentage points from 62.32% on Aug. 18, according to Maketo’s HODL-wave data.
HODL waves group Bitcoin’s unspent transaction outputs into age bands based on their last on-chain movement. The rising one-year share therefore shows that more supply now sits in older bands. Current-month buying and deliberate withdrawal from the market require separate evidence.
The underlying bands point to a specific mechanism. Coins that last moved roughly a year ago can enter the one-to-two-year bracket simply by remaining still long enough to cross the boundary.
What Bitcoin HODL waves measure
The one-to-two-year band increased to 14.57% of supply from 13.52% between Aug. 18 and Sept. 18, a gain of 1.05 percentage points. That was the largest positive change among the cohorts already older than one year.
Over the same period, the six-to-twelve-month band fell to 17.53% from 19.10%. Glassnode’s Sept. 18 snapshot showed the same latest values for both bands.
The paired moves are consistent with coins crossing the one-year boundary. Each band is a net share after coins age into it, age out of it or move on-chain and reset to the youngest cohort, leaving the identity and gross flow of the underlying units unresolved.
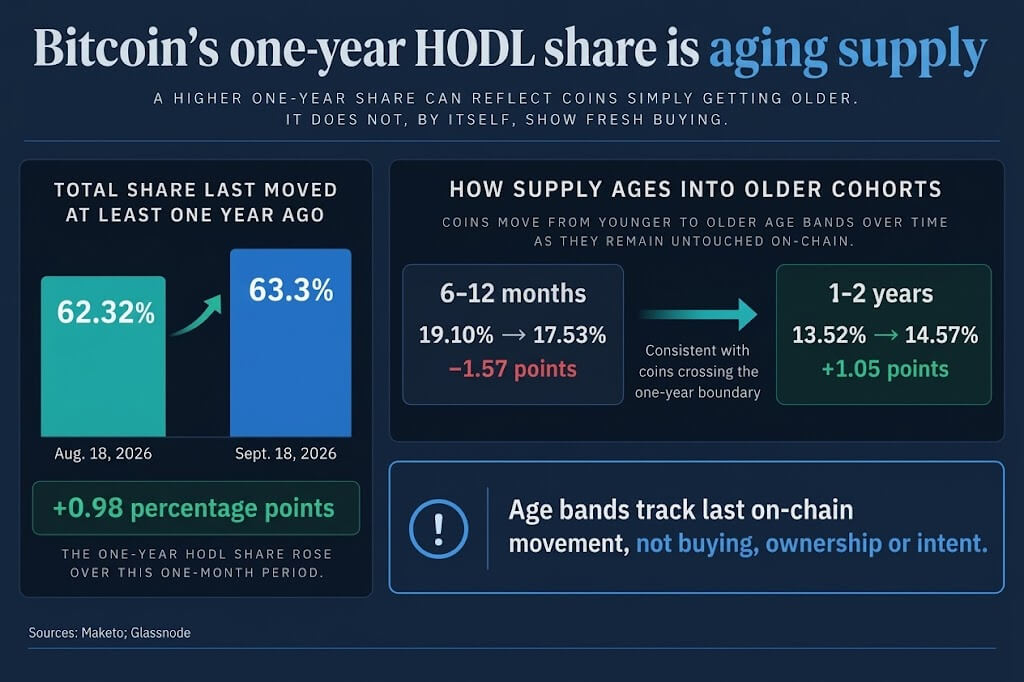
Recent movement also eased. Coins last moved within one month accounted for 7.03% of supply on Sept. 18, down 0.27 percentage points from 7.30% a month earlier.
Under Glassnode’s methodology, an unmoved output advances into older bands as it crosses each age threshold. Movement resets the clock.
Last-movement age leaves beneficial ownership and intent unresolved. A transfer between wallets controlled by the same person or custodian can make an output look young even when ownership has not changed. Lost coins can remain in the oldest bands without representing a deliberate decision to hold.
Coinbase provided a practical example in November 2025 when it warned that an internal wallet migration would create large on-chain volumes unrelated to market conditions. That episode illustrates attribution uncertainty and is not offered as the cause of the current shift.
The Sept. 18 readings support a limited conclusion: Bitcoin’s on-chain age distribution grew older while the share moved within a month declined. Available-for-sale supply and liquid-supply tightening remain unmeasured.
Identifying a fresh-accumulation thesis needs corroboration from entity-adjusted balance changes, exchange flows, and spending behavior. Until those measures align, the rising one-year wave is an aging signal rather than proof of new demand.

Bitcoin is -0.97% over the past 24 hours and currently sits at rank #1 by market cap.
Mentioned in this article
Editorial credits