
Quick Take
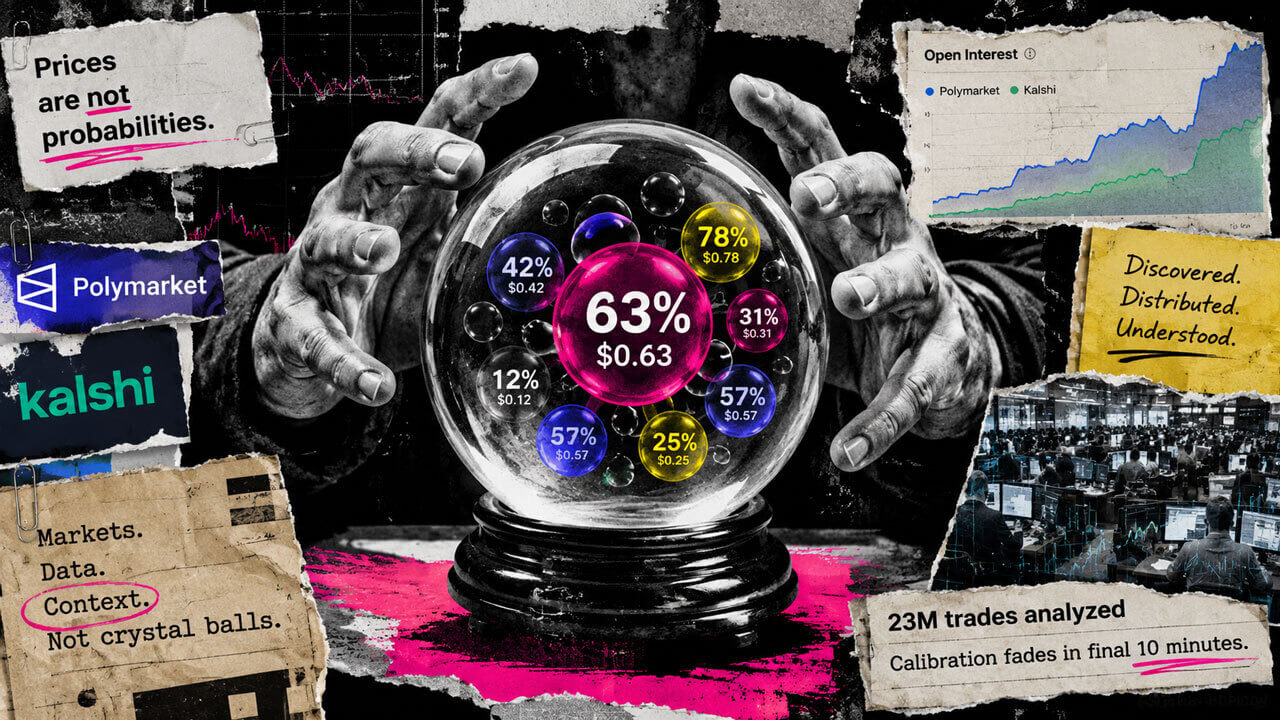
- PredictionBubbles maps Polymarket and Kalshi markets onto one dashboard of bubbles showing probability, price movement, and volume.
- The tool gives traders a screening layer for thousands of markets, using filters and bubble sizing like stock or crypto heat maps.
- Recent papers show raw prediction prices can mislead without context, leaving open how to interpret contract terms and late-trading effects.


PredictionBubbles is a dashboard that maps prediction markets, such as Polymarket and Kalshi, onto one screen.
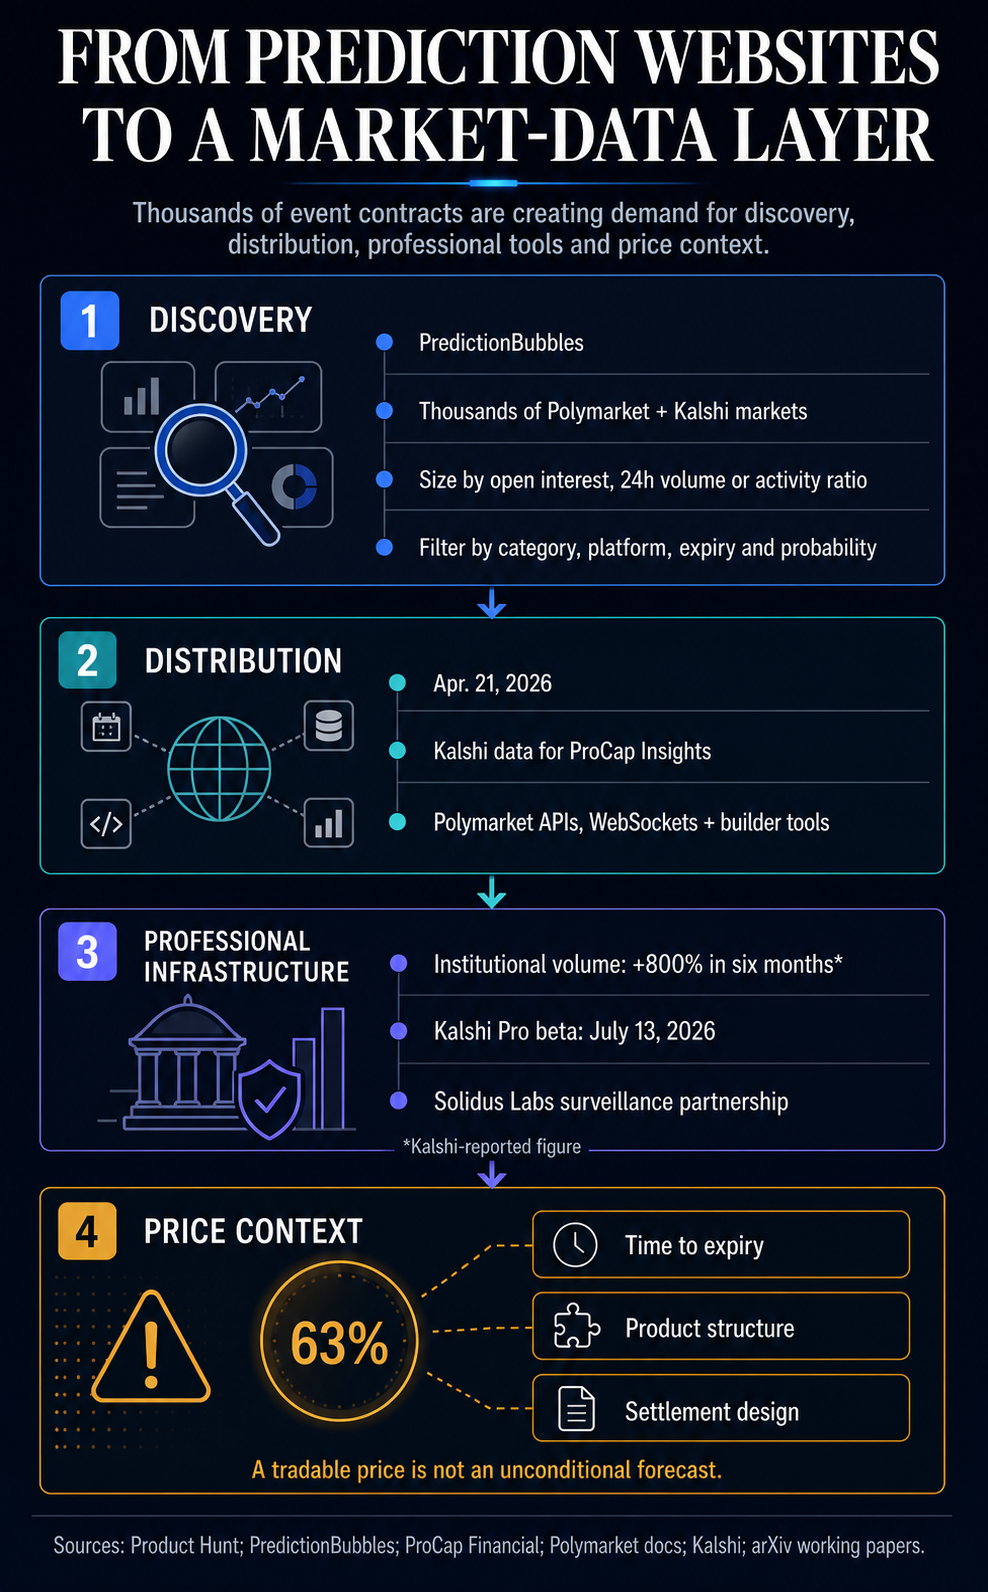
The platform turns its tradable questions into bubbles that show probability, price movement, and volume, offering a discovery view of two venues that have traditionally required users to browse individual markets.
The live site lets users size bubbles by open interest, 24-hour volume, or an activity ratio, then filter by category, platform, expiry, probability, and open interest. The format resembles the screeners and heat maps used to scan stocks or crypto assets.
In April, ProCap Financial said Kalshi Research would feed real-time prediction market figures into ProCap Insights. The companies described it narrowly as Kalshi's first supply agreement with a financial research provider serving paying subscribers.
Meanwhile, Polymarket documents public market-discovery and analytics APIs, along with public order-book and pricing data. Its developer materials also describe near-real-time market WebSocket feeds and a builder program for third-party applications.
Kalshi said in May that institutional trading volume had increased 800% in six months, a company-reported figure. It released Kalshi Pro in beta in July for people managing many markets and resting orders.
In February, Kalshi separately announced a surveillance advisory committee and a technology partnership with Solidus Labs, the effectiveness of which has not been independently established.
A price that looks like a 63% probability still reflects a particular contract, trading window, and settlement method rather than an unconditional forecast.
An unreviewed July working paper analyzing roughly 23 million Kalshi NBA, MLB, and NHL moneyline trades found calibration was strongest during the middle of contracts and deteriorated in the final 10 minutes.
In a limited sample of 12,639 filtered parlay trades collected over 15 days, median pricing for two- to four-leg combinations was at or slightly below parity, while overpricing became clearest in higher-leg combinations.
A separate unreviewed June paper on Polymarket's five-minute Bitcoin contracts found a spike in Binance spot flow during the final 10 seconds and a reversal after the close.
The footprint was weaker in 15-minute contracts, with no comparable reversal detected. Binance was a proxy for contracts settled against Chainlink, and any causal interpretation remains an inference.
Prediction markets once competed mainly over which questions they could list. As thousands of answers become tradable at once, the next competition is increasingly about who can organize those prices, distribute them, and help users understand what they mean.
Mentioned in this article




Editorial credits