
Quick Take
- US spot Ether ETFs posted five straight outflow days, shedding about $206 million as ETH traded near $2,700.
- ETF weakness is hitting demand just as Ethereum’s estimated leverage ratio falls to a seven-month low and aggressive derivatives selling intensifies.
- Traders are watching whether ETF withdrawals spread to exchange supply or ETH continues absorbing aggressive selling.


Ethereum’s institutional demand is weakening around the same time derivatives positioning shows traders are selling aggressively without yet breaking the broader price structure.
US spot ETH exchange-traded funds recorded $50.76 million of net outflows on Oct. 5, extending their losing streak to five consecutive sessions, according to SoSoValue data. The products have shed $205.88 million since Sept. 29, reducing cumulative net inflows to about $13.75 billion.
The streak followed a $17.1 million inflow on Sept. 28 and has coincided with ETH trading near $2,711, leaving one of the market’s major sources of incremental demand in retreat.
Yet the pressure has not spread uniformly across Ethereum’s investor base.
Blockchain analytics firm Santiment said Ethereum’s Age Consumed metric surged to 580 million token-days on Sept. 30, roughly nine times its September weekday average and the highest reading since June 2. The indicator tracks previously dormant coins moving onchain, weighted by how long they had remained untouched.
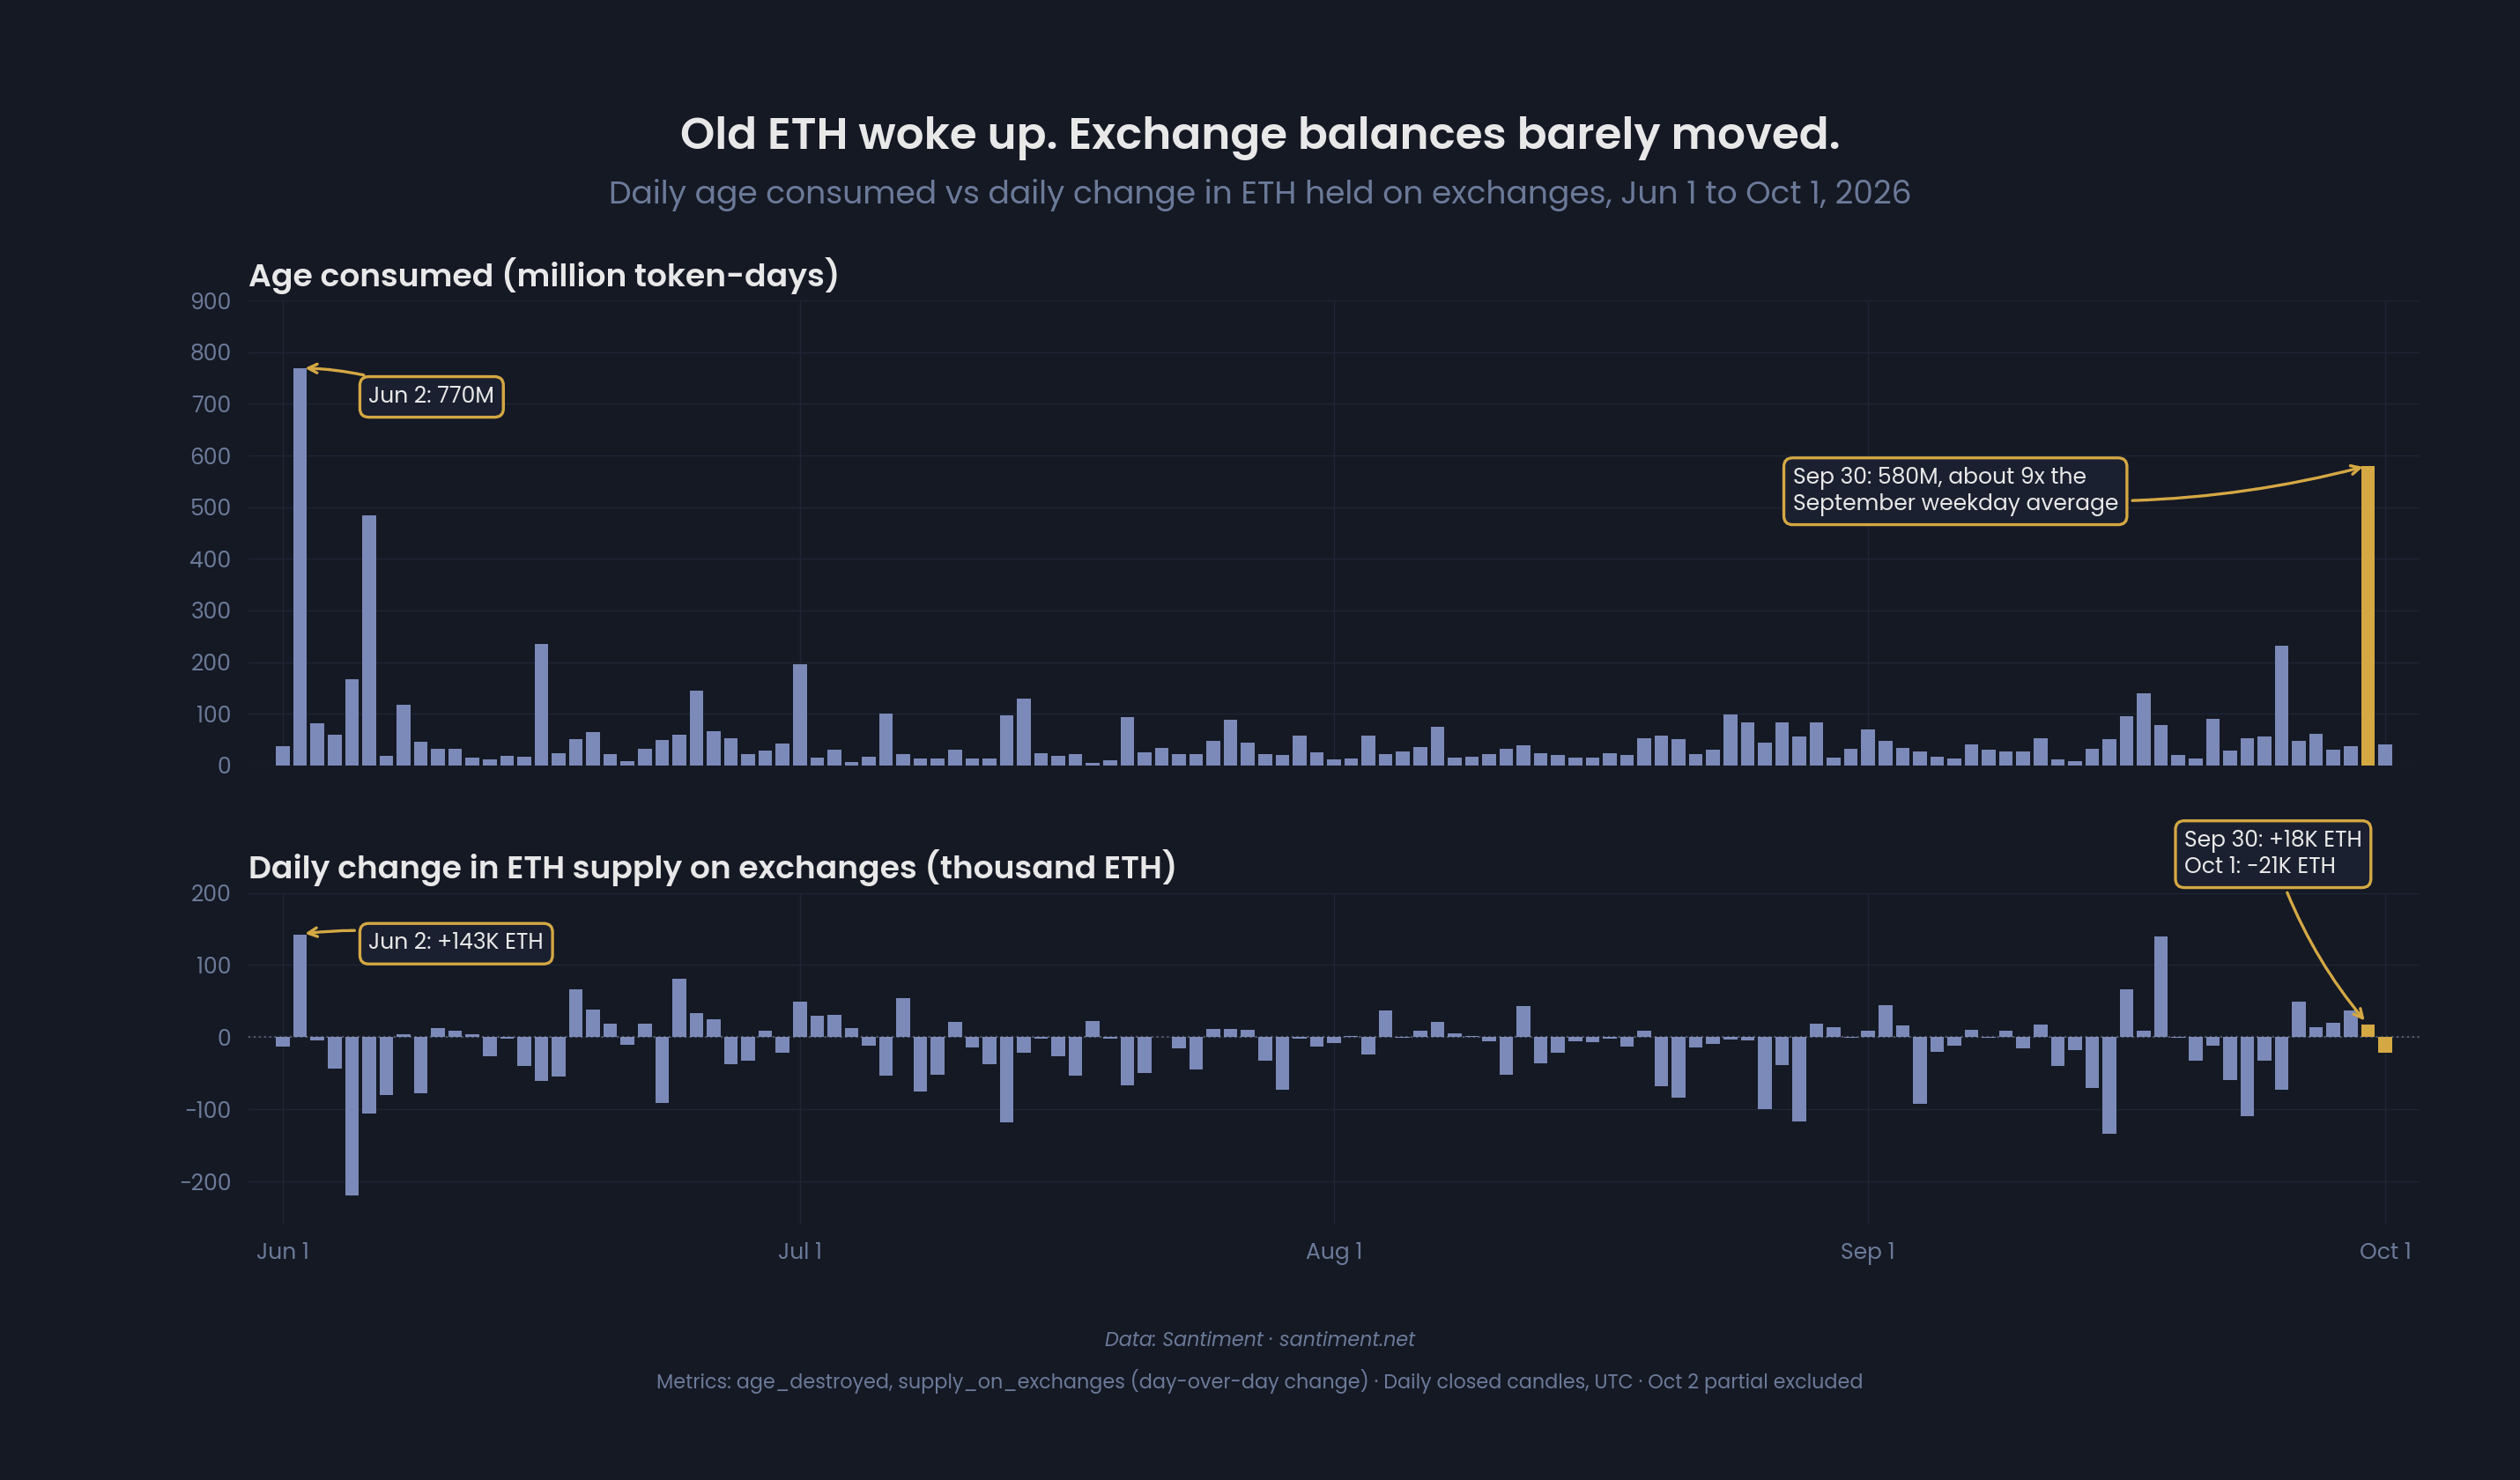
Large spikes can signal that long-term holders are repositioning assets and, in some cases, preparing to sell. Aggregate exchange balances, however, barely changed across Sept. 30 and Oct. 1.
Ethereum held on exchanges rose by only about 18,000 ETH on Sept. 30 before falling roughly 21,000 ETH the next day, against approximately 5.9 million ETH held on trading venues. When Age Consumed last registered a larger spike on June 2, exchange balances increased by more than 140,000 ETH.
That contrast leaves open the possibility that the September activity reflected custody transfers, staking movements or wallet reorganizations rather than broad distribution by older holders.
ETH derivatives traders lean bearish without forcing a breakdown
The more immediate pressure is showing up in the derivatives markets, though signals there are also unusually mixed.
CryptoQuant data shows Ethereum’s Estimated Leverage Ratio has fallen to 0.66, its lowest level in seven months, indicating that open derivatives exposure has declined relative to ETH reserves held on exchanges. The ratio stood near 0.68 on Binance and 0.64 on OKX after trending lower in recent weeks.
CryptoQuant contributor Arab Chain interprets the decline as weaker appetite for heavily leveraged positions as ETH trades around $2,700, potentially easing liquidation pressure.
On Binance, ETH open interest remains near $3.3 billion, up from about $2.3 billion on Aug. 6, a roughly 43% increase, CryptoQuant data shows. At the same time, Cumulative Net Taker Volume, or CVD, has swung sharply in the opposite direction.
Binance ETH CVD fell from $1.94 billion on Aug. 21 to -$1.36 billion on Oct. 5, a $3.30 billion reversal and its weakest reading since Aug. 6. The metric captures the balance between aggressive market buying and selling, with the negative reading showing sellers increasingly crossing the spread to execute trades.
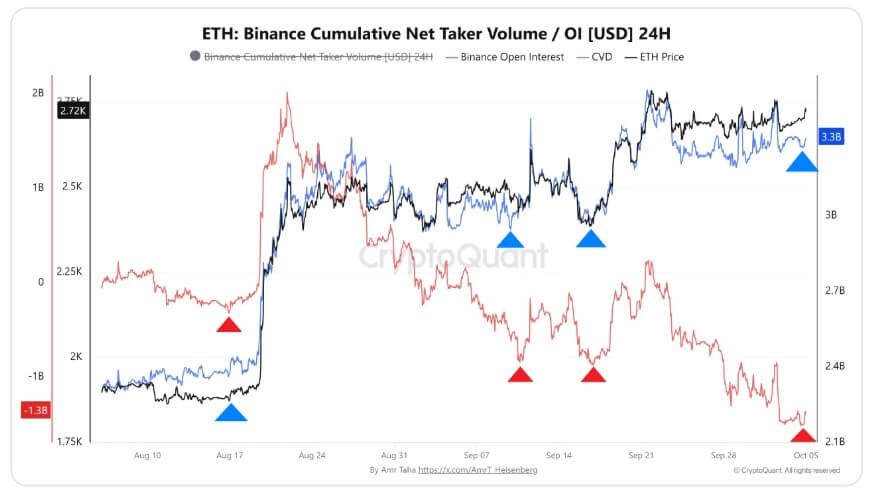
Ethereum, however, remains roughly 44% above its Aug. 6 level, meaning the surge in aggressive selling has yet to unwind the broader price advance.
That divergence is reinforced by the relationship between CVD and open interest. CVD has continued to make lower lows while open interest lows have generally moved higher, a pattern consistent with substantial outstanding derivatives exposure as aggressive sellers take a larger role in order flow.
The combination can become constructive if ETH continues absorbing that supply. Heavy taker selling alongside resilient prices can indicate that buyers are absorbing aggressive sell orders.
A short squeeze remains a conditional scenario, with funding rates providing additional evidence about positioning. If funding turns persistently negative while ETH holds its range, short sellers would increasingly pay long positions to maintain exposure, raising the potential for covering to become an additional source of demand.
For now, three forces are pulling the market in different directions. ETF investors are withdrawing capital, dormant coins are moving while aggregate exchange balances remain little changed, and derivatives traders are selling more aggressively while maintaining substantial exposure.
The next break in that balance could come from either side.
Continued ETF withdrawals, paired with a meaningful rise in exchange balances, would broaden selling pressure beyond financial products. But if exchange reserves stay contained and ETH continues absorbing negative derivatives flow, traders running short exposure could become increasingly vulnerable to any recovery in institutional demand or a shift in funding conditions.
Mentioned in this article





Editorial credits