

Quick Take
- Bitcoin briefly topped $65,000 after US second-quarter GDP growth missed forecasts at 1.5%.
- Strong consumer spending and sticky inflation weakened the case for near-term Fed rate cuts.
- Bitcoin’s thin volume and $69,000 holder cost basis leave its breakout vulnerable to selling pressure.


Bitcoin briefly topped $65,000 on Thursday after US economic growth fell short of forecasts.
Data from CryptoSlate show the largest cryptocurrency trading near $64,729 as of press time after reaching an intraday high of $65,071 and recovering from a low of $63,205.
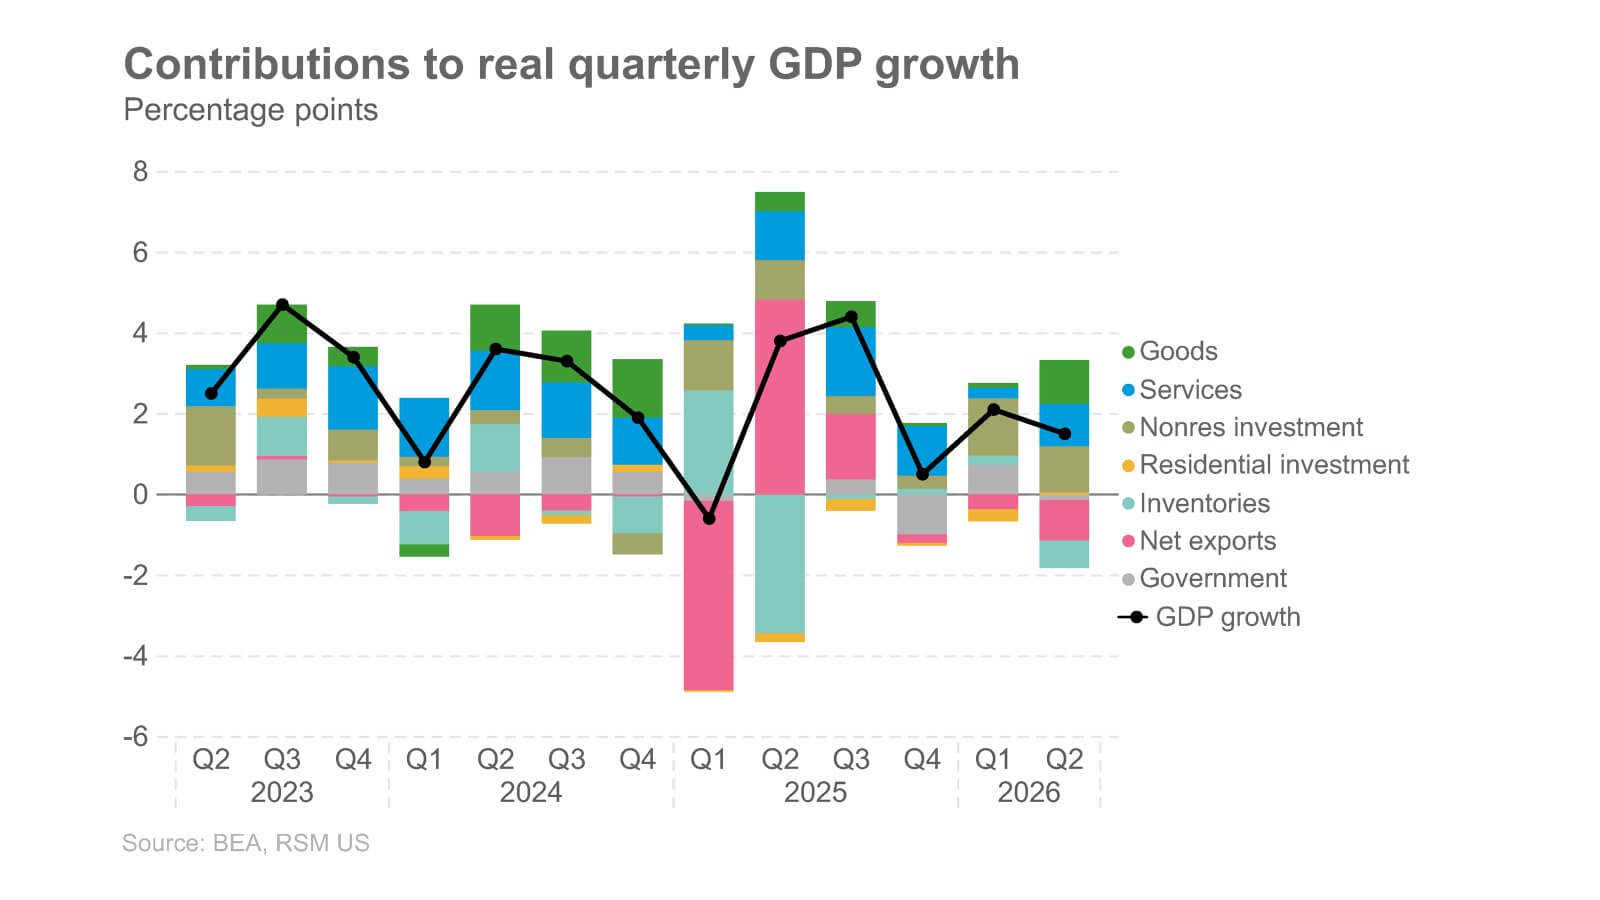
The advance followed data showing the US economy expanded at a 1.5% annualized rate in the second quarter. That was below both the first quarter’s 2.1% pace and analysts' forecast of 2.1% growth.
The headline miss initially offered a favorable setup for Bitcoin because weaker growth can increase pressure on the Federal Reserve to ease monetary policy. Lower rates would reduce the appeal of cash and government bonds while improving liquidity conditions for risk assets.
Strong consumer spending and persistent inflation, however, offered little evidence that lower interest rates were approaching.
Strong domestic demand limits the dovish signal
Consumer spending and equipment investment showed that the slowdown was concentrated in trade rather than domestic demand.
Household spending accelerated at a 3.2% annualized rate during the quarter after rising only 0.5% in the first three months of the year. Business investment in equipment also remained robust as companies continued spending on technology and infrastructure linked to the buildout of artificial intelligence.
Joseph Brusuelas, principal and chief economist at RSM US, said the widening trade deficit subtracted about one percentage point from headline growth, making the 1.5% reading a misleading measure of the economy’s underlying momentum.
He attributed much of the increase in imports to equipment needed to sustain AI investment, arguing that the trade figures reflected economic expansion rather than an approaching contraction.
Brusuelas said:
“Once one looks beneath the topline, growth looks much firmer and inflationary.”
The inflation data reinforced that assessment. The gross domestic purchases price index rose at a 5.7% annualized rate during the quarter, while core personal consumption expenditures prices increased 3.4%, remaining above the Fed’s 2% target.
The combination of stronger household spending, business investment and persistent inflation gives the Fed less reason to respond to the headline slowdown with easier policy.
Brusuelas said policymakers are more likely to focus on the resilient consumer, rising energy costs and an underlying inflation rate that remains above 3%.
Those pressures could intensify disagreements within the central bank after three officials voted in favor of raising rates at Wednesday’s meeting. The Fed ultimately held its benchmark rate at 3.50% to 3.75%.
Treasuries out-yield Bitcoin’s institutional carry trade
For Bitcoin, the strength beneath the GDP report weakens the bullish interpretation of the headline miss.
Resilient demand and persistent inflation reduce the likelihood that rate cuts or easier liquidity conditions are approaching, leaving Bitcoin’s brief move above $65,000 short of a decisive policy-driven breakout.
Glassnode data show that institutions also have limited incentive to chase the advance.
The three-month Bitcoin futures basis, which measures the return available from the cash-and-carry trade used by institutional desks, has remained below the two-year Treasury yield since February.
Glassnode said this is only the second prolonged period on record in which government debt has offered a higher return than the Bitcoin trade.
That gap allows investors to earn competitive yields from Treasuries without accepting Bitcoin’s volatility. It also reduces the incentive for institutional desks to supply the leverage, liquidity and market depth that often support stronger rallies.
The lack of participation is visible across the market. Spot trading volume measured in Bitcoin has fallen to its lowest level since 2019, while combined exchange deposits and withdrawals are near their quietest levels in three years.
US spot Bitcoin exchange-traded funds have also returned to modest net outflows after briefly attracting fresh capital in mid-July.
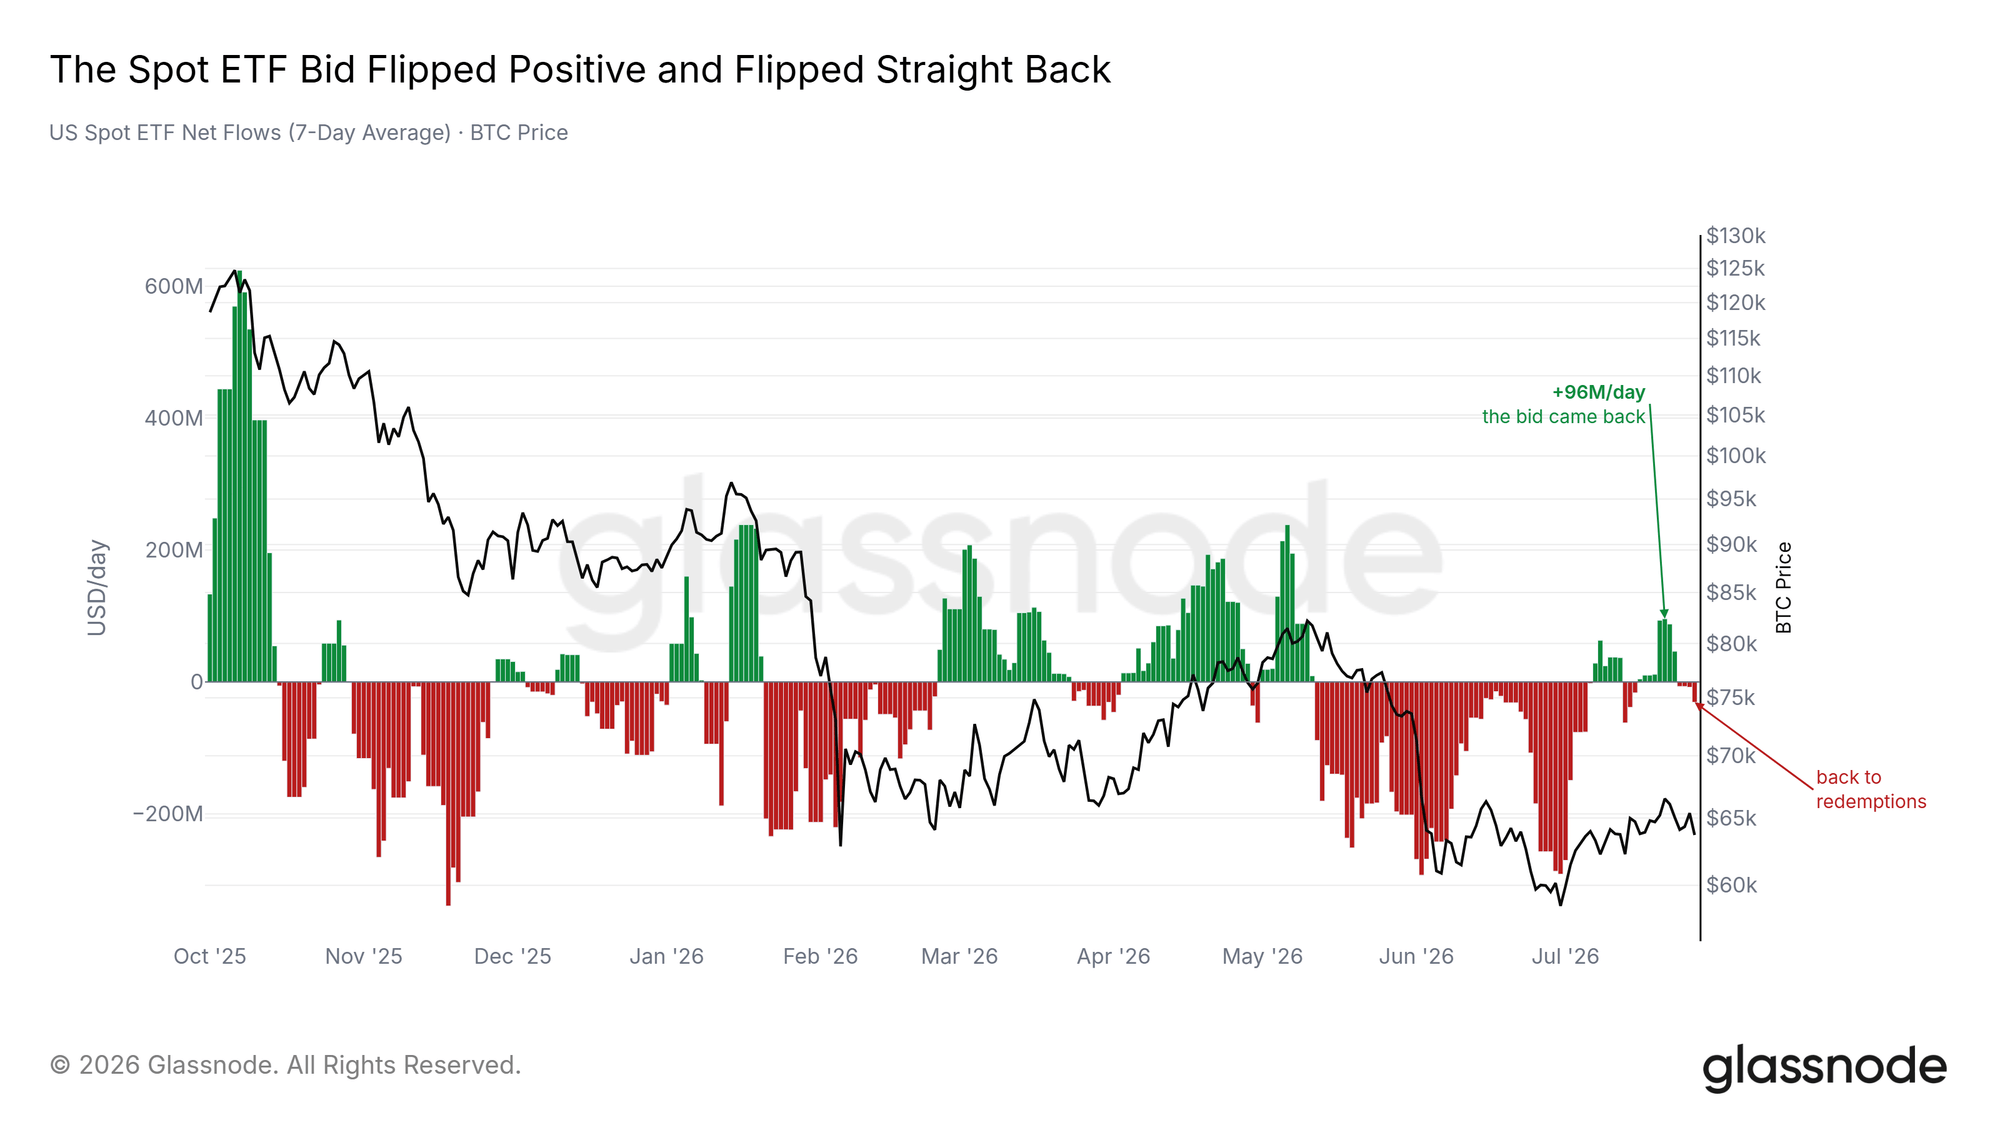
Those indicators show neither aggressive selling nor the persistent buying needed to push Bitcoin decisively higher.
Bitcoin faces its next test near $69,000
Bitcoin’s advance is now moving through its largest concentration of investor cost bases, creating support beneath the market and potential selling pressure overhead.
Glassnode data show that more coins last changed hands between approximately $62,000 and $68,000 than in any other price range.
Long-term holders control about half of that supply, while shorter-term investors hold the remainder and may be more inclined to sell as prices return toward their entry levels.
That structure helps explain why repeated attempts to push Bitcoin below the $62,000 to $63,000 area failed before the Fed meeting.
CryptoQuant data showed shorts were unable to force a breakdown, while a taker buy-sell ratio near 1.0 indicated that neither aggressive buyers nor sellers had established clear control.
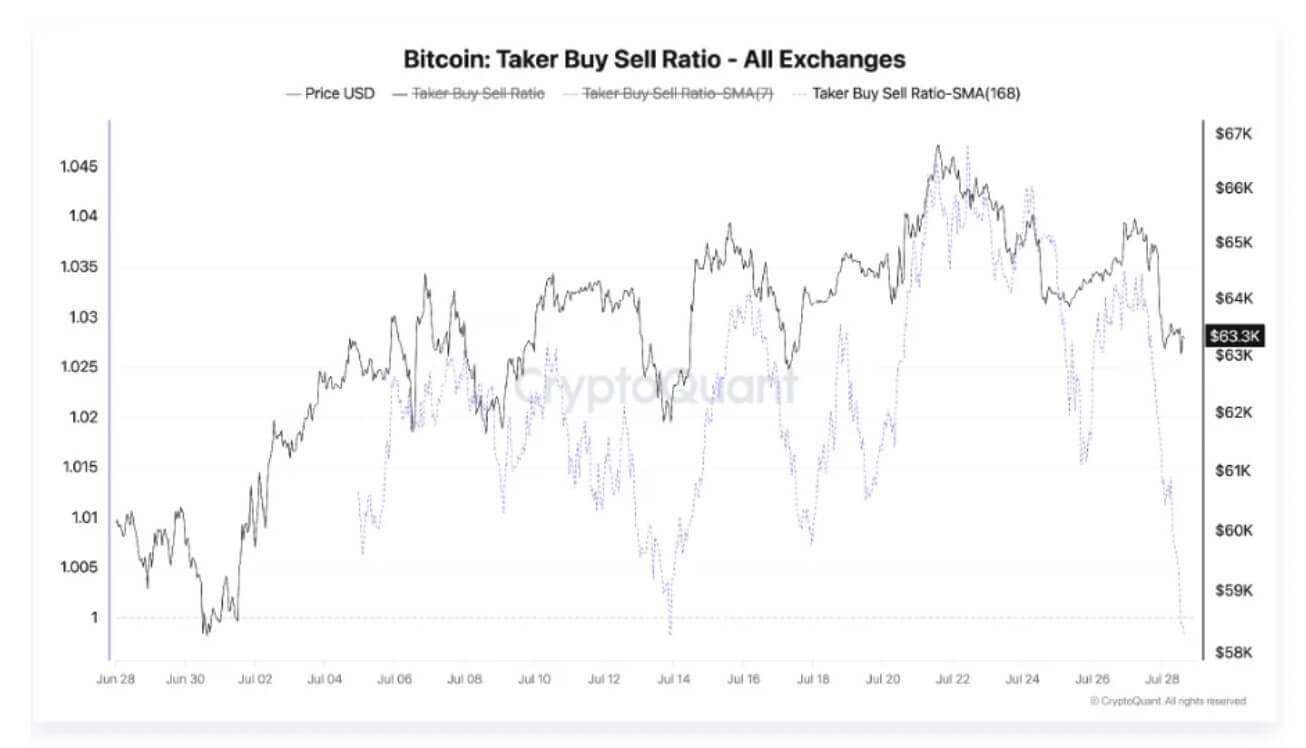
Still, Bitcoin’s move toward $65,000 has not yet attracted the broader participation required for a breakout. The cryptocurrency remains inside the heavily populated $62,000 to $68,000 range, where recovering short-term holders could use further gains to exit around breakeven.
Glassnode places the aggregate short-term holder cost basis near $69,000, making that level the next significant test of whether fresh demand is entering the market.
A sustained move through the $68,000 to $69,000 area, particularly alongside stronger spot volumes and renewed ETF inflows, would suggest buyers are absorbing the supply accumulated throughout the range.
Failure to clear that zone would keep Bitcoin confined to consolidation as investors await clearer evidence that inflation and monetary policy are turning more supportive.

Bitcoin is +2.25% over the past 24 hours and currently sits at rank #1 by market cap.
Mentioned in this article


Editorial credits