


CryptoSlate’s rebuilt Coin Discovery lets you compare assets using customizable columns, combined filters and a browser-based watchlist, without an account or subscription. Start on Coin Rankings, choose the metrics you want to compare, and narrow the market by sector, network, size or performance.
Available across Coin Rankings, Sectors, Biggest Gainers, Biggest Losers, Highest Volume, Recently Added, and sector and network pages.
On Coin Rankings, readers can now customize columns, combine asset filters, and build a watchlist. Readers do not need an account, subscription, or app update.
Watch the 28-second demo: choose a preset, add a metric and make the columns your own.
Choose the columns that answer your question
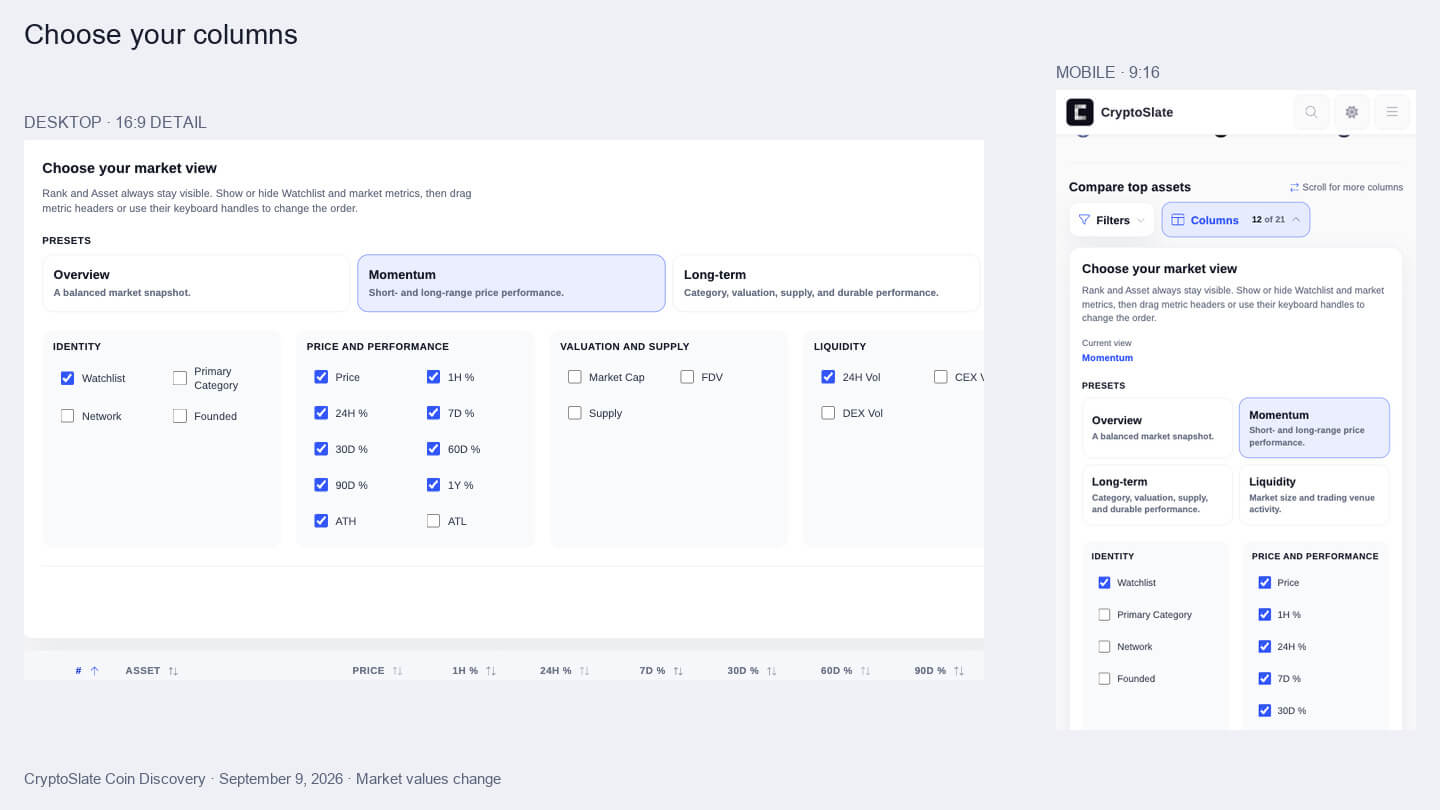
Open Columns above the table to choose from 21 optional columns. Rank and Asset always stay visible; you can show or hide Watchlist and individual metrics. The selection includes price changes from one hour to one year, primary category, network, founding year, supply, all-time highs and lows, and fully diluted valuation (FDV). Volume columns separate activity on centralized and decentralized exchanges.
Four presets give you a starting point. Overview offers a balanced market snapshot. Momentum groups short- and long-range price performance. Long-term brings together category, valuation, supply and longer-term performance. Liquidity focuses on market size and trading venue activity. Adjust the checkboxes to make your own view, or use Reset to return to the default.
Select a column heading to sort the assets shown on the current page. Drag a metric's handle to rearrange columns, or focus it and use Left Arrow, Right Arrow, Home or End. Your layout stays in that browser. On a phone, swipe horizontally through the metrics while the identifying columns remain in view.
Filter the market before comparing assets
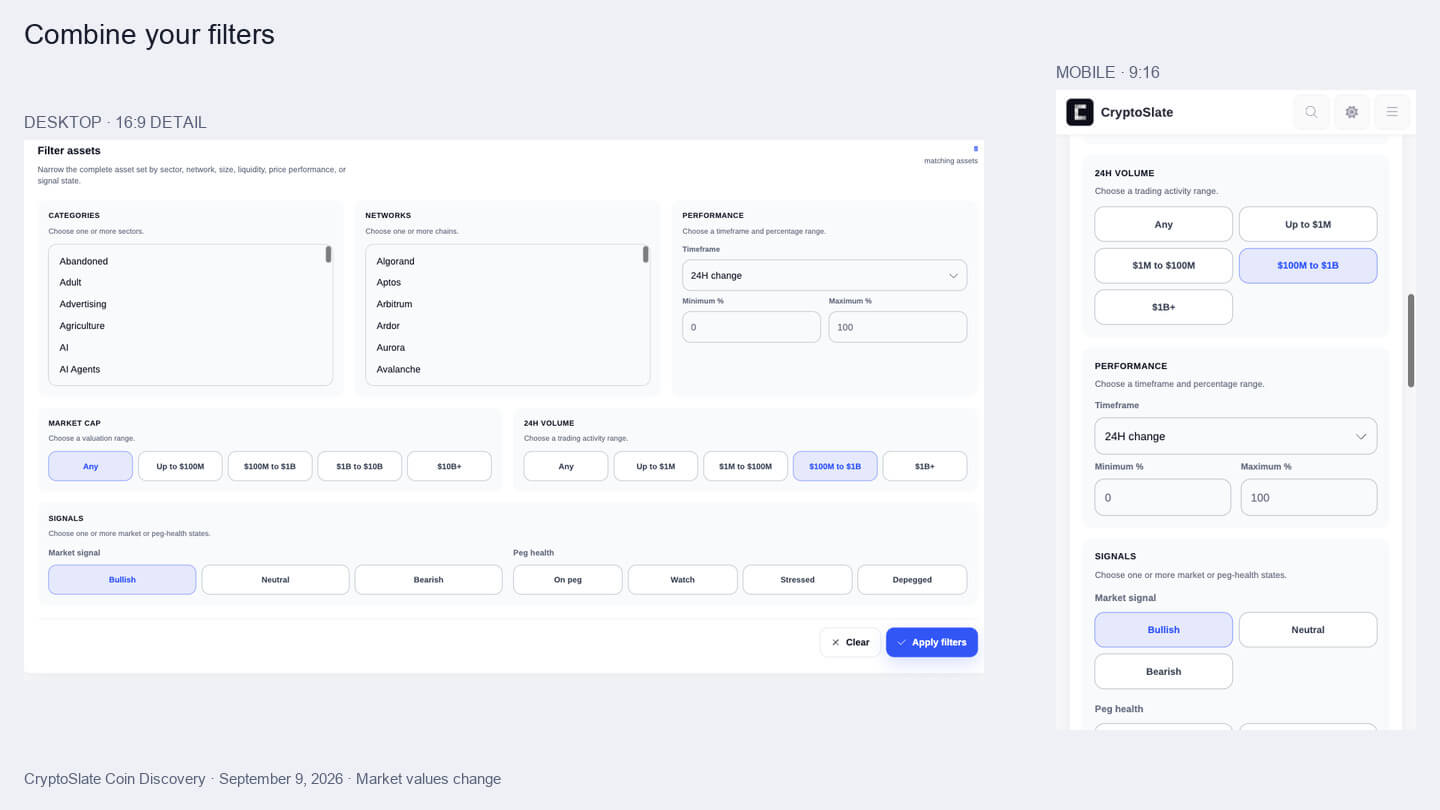
Open Filters to narrow the complete asset set by one or more categories or networks, market-cap range, 24-hour volume, price performance, or signal state. For performance, choose a timeframe from one hour to one year and enter a minimum or maximum percentage change.
Filters narrow the full asset list. Column headings can be used to sort the assets on the current results page.
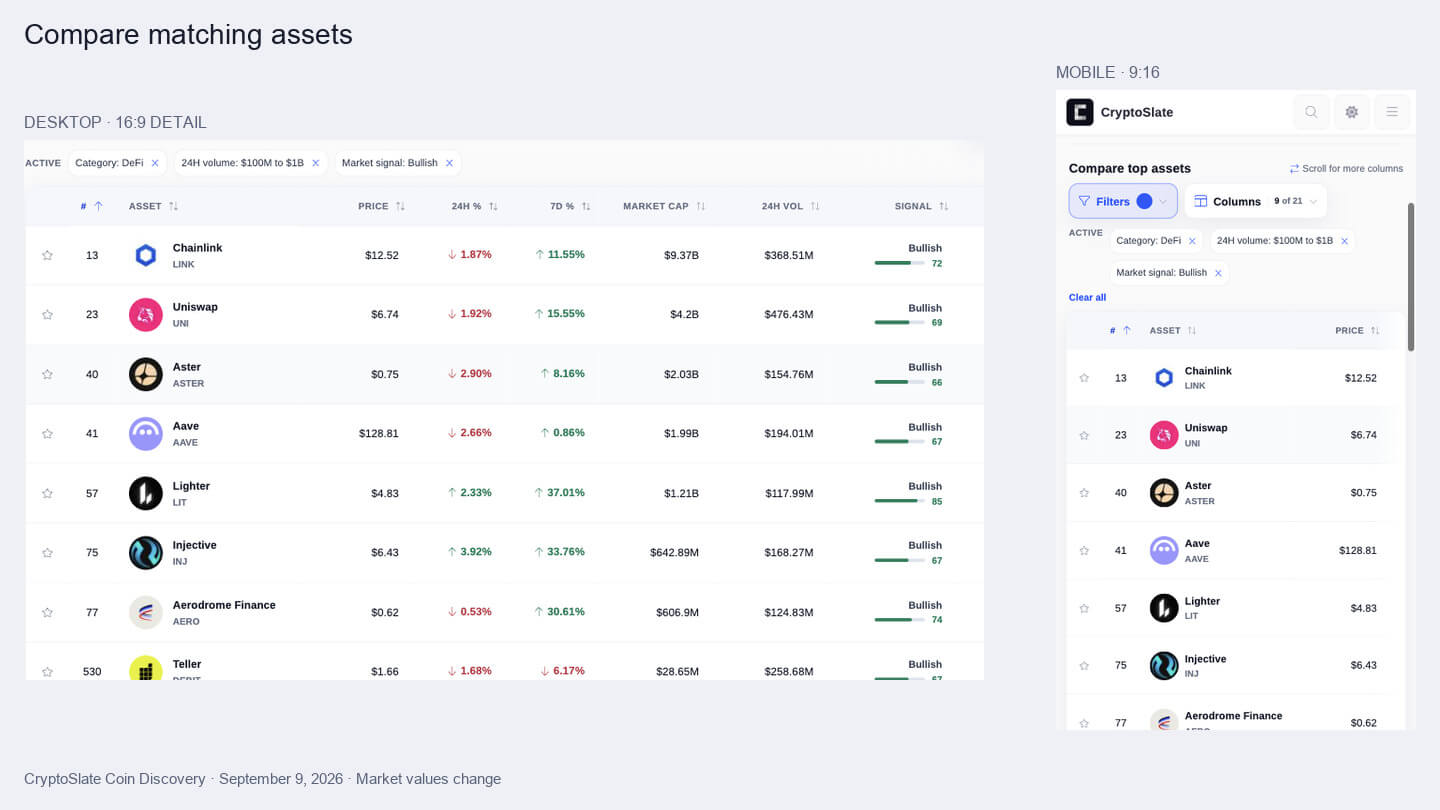
You can combine these controls. For example, choose DeFi, a daily volume range of $100 million to $1 billion, and Bullish under Market signal, then select Apply filters. The results show assets matching that combination. Active filter chips make the selection visible; remove one chip to broaden the results or choose Clear all to start again.
Save assets and explore related markets
Select the star beside an asset in a discovery table or on a profile such as Bitcoin. A Watchlist tab appears after the first save. Watchlists hold up to 200 assets, are stored in your browser, but do not sync across browsers or devices.
The Asset Directory groups market views, sectors and chains. Sector pages such as DeFi and network pages such as Ethereum add summaries for that group alongside the comparison table.
Stablecoin rows show Peg Health instead: On peg, Watch, Stressed or Depegged. These states are also available in Filters. Peg Health measures tracking of a reference value; it does not assess reserves, redemption mechanics or issuer risk.
Try the columns and filters in Coin Discovery.
CryptoSlate market data, Market Signals (Coming Soon), and Peg Health labels are informational. They are not investment or financial advice, do not guarantee an outcome, and may be wrong or fail to capture conditions outside the scenarios shown. Read the full CryptoSlate disclaimers before making financial decisions.