
Quick Take
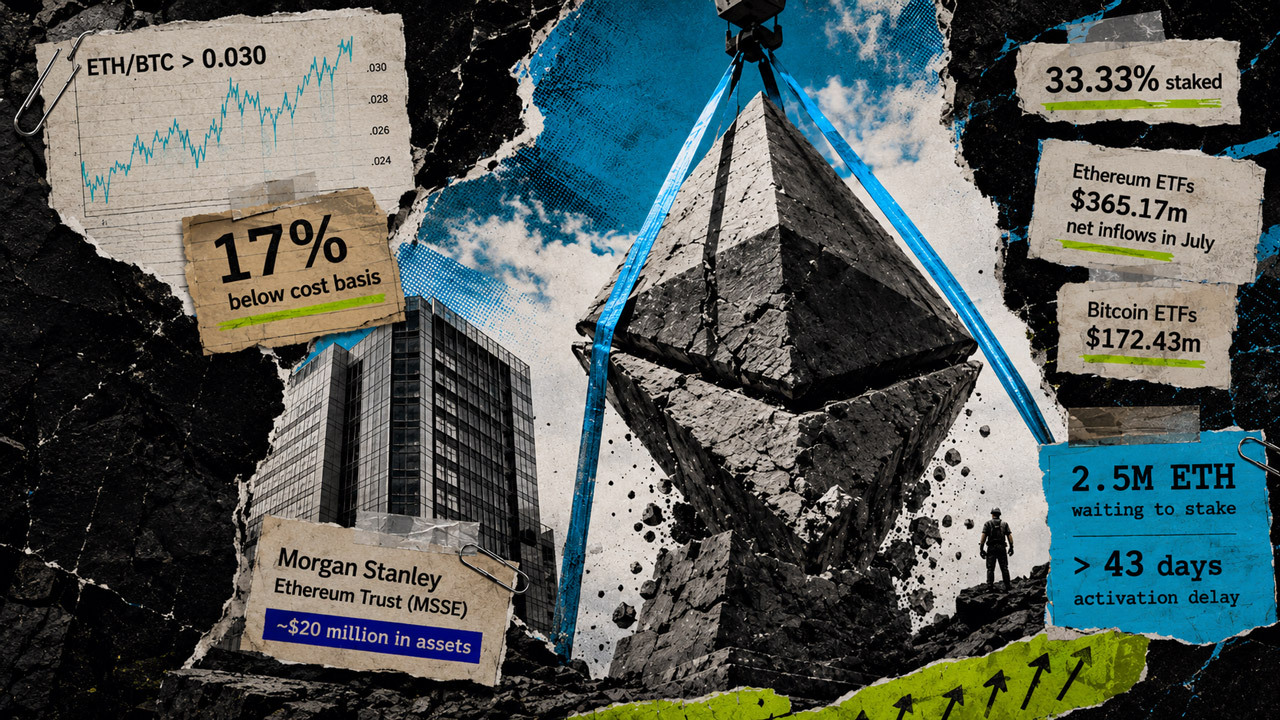
- Ethereum gained 19% in July versus Bitcoin’s 8%, lifting ETH/BTC above 0.030 before the ratio eased.
- US spot ETH ETFs drew $365.17 million as BitMine added Ether, while Strategy made no Bitcoin purchases.
- MVRV and exchange-flow ratios remain above prior ETH/BTC bottoming levels, leaving the reversal unconfirmed.


Ethereum outpaced Bitcoin in July as stronger investment-product demand and corporate accumulation powered its first sustained relative advance in months.
Data from CryptoSlate shows that ETH gained 19% during the month, climbing as high as $1,970 before retreating to $1,868 as of press time. Bitcoin rose 8% over the same period but repeatedly failed to break the $65,000 level.
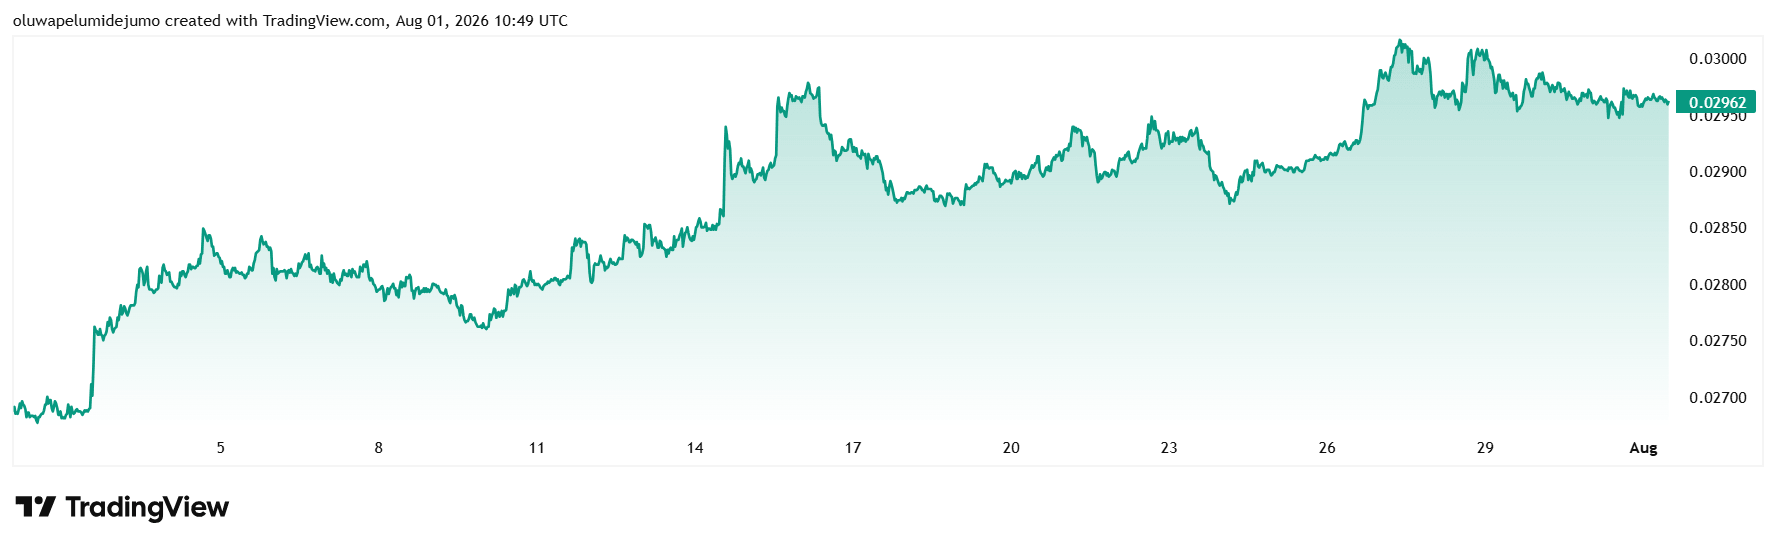
The divergence pushed the ETH/BTC ratio above 0.030 for the first time in three months before it eased to 0.02962. The pair has risen more than 10% over the past month, reflecting Ethereum’s widening performance advantage.
The rebound has strengthened expectations that capital is rotating back toward Ethereum after almost a year of underperformance.
However, on-chain indicators remain less conclusive, with several measures still short of the levels that accompanied previous reversals against Bitcoin.
ETH ETF flows and treasury buying reinforce the move
Ethereum’s July advance spread beyond spot markets as regulated funds attracted fresh capital and derivatives traders began rebuilding exposure.
US spot Ethereum ETFs recorded $365.17 million in net inflows during the month, their strongest performance this year, SoSoValue data showed. In comparison, Bitcoin ETFs drew $172.43 million over the same period, their weakest monthly total since launching in January 2024.
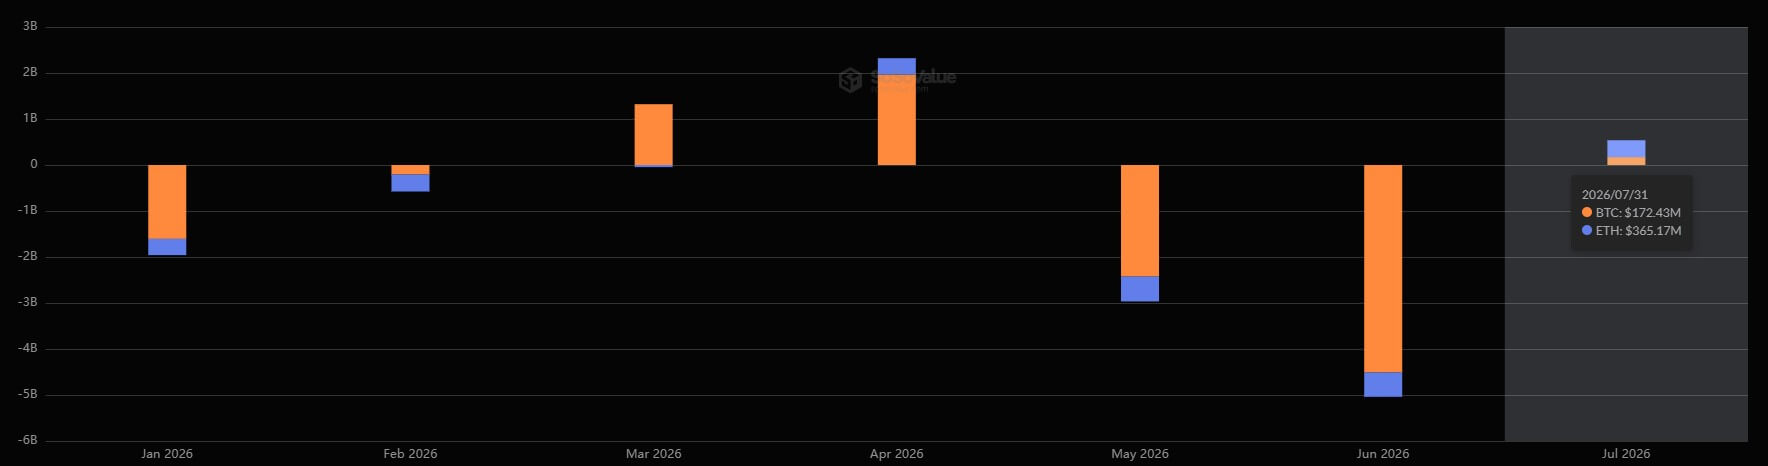
This inflow marked a significant turnaround for ETH-focused products, which had recorded more than $1 billion in outflows over the preceding two months.
Ethereum’s strong performance was bolstered by the launch of the Morgan Stanley Ethereum Trust, which trades under the ticker MSSE and has accumulated about $20 million in assets during its first days of trading.
While the total remains small compared with established ETH ETFs, Morgan Stanley’s distribution network gives the product access to a large pool of advisers and wealth-management clients. The firm has roughly 16,000 financial advisers overseeing about $7 trillion in client assets.
That reach could help MSSE draw investors who have had limited exposure to crypto-focused asset managers, while its low 0.14% fee increases competition among existing ETH products.
Meanwhile, corporate treasury demand moved in the same direction.
BitMine, the largest corporate holder of Ether, increased its holdings during each week of July, though its pace of accumulation slowed. Its balance rose from about 5.70 million ETH at the end of June to 5.79 million ETH as of July 26.
Strategy, the largest corporate holder of Bitcoin, made no purchases during the month. Instead, the Michael Saylor-led company focused on increasing its cash reserves and supporting its preferred securities after serving as a recurring source of Bitcoin demand earlier in the year.
The divergence left Ethereum with continued corporate accumulation alongside stronger ETF inflows, while Bitcoin’s largest treasury buyer made no new purchases.
Valuation metrics signal July’s rally lacks historical bottoming signatures
While July injected much-needed momentum into Ethereum, the asset has not yet triggered the structural signals that historically preceded a durable cycle reversal against Bitcoin.
Data from TradingView shows that the ETH/BTC ratio remains 13% lower this year and about 73% below a 2017 high of 0.11.
This means that its stabilization near 0.02963 has halted the decline from a multiyear low of roughly 0.028, but has done little to repair Ethereum’s broader loss of value relative to Bitcoin.
That distance from previous highs shows the scale of Ethereum’s underperformance, though price alone cannot establish whether the decline has run its course. CryptoQuant’s valuation and exchange-flow indicators offer a clearer test by comparing current conditions with those recorded before earlier ETH/BTC reversals.
The ETH/BTC market-value-to-realized-value ratio has fallen to 0.65 from 0.95 in August 2025, showing that much of the premium that preceded Ethereum’s decline has dissipated.
Previous structural bottoms, including those recorded in 2019 and early 2025, emerged only after the measure dropped below 0.45.
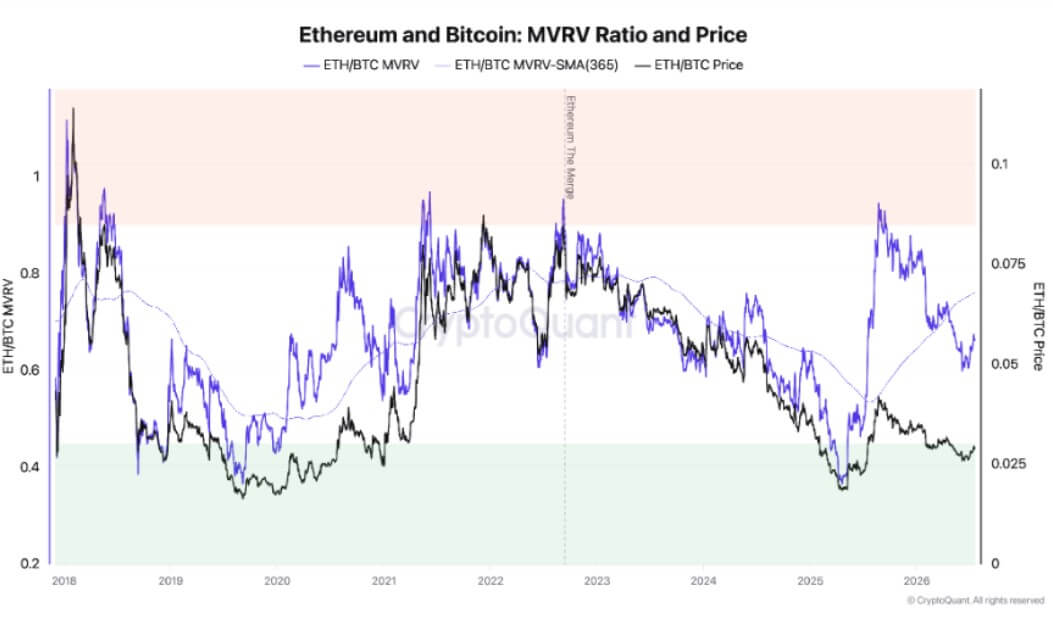
Ethereum has therefore moved away from the overvaluation that marked last year’s peak without reaching the deeper compression associated with previous turning points.
Exchange flows show the same incomplete adjustment. The ratio of ETH to Bitcoin deposits on trading platforms has fallen from above 1.5 last August to about 0.8, indicating that relative selling pressure has eased sharply.
Earlier ETH/BTC reversals formed when the ratio approached 0.4. The current reading suggests that the heaviest distribution has subsided, while selling activity remains above the levels seen when previous declines reached exhaustion.
For July’s momentum to develop into a broader reversal, ETH/BTC would need to establish support above 0.030 while valuation and exchange flows continue moving toward their historical bottoming ranges.
Until then, the data points to a recovery from depressed levels rather than a confirmed cyclical floor against Bitcoin.

Ethereum is -1.70% over the past 24 hours and currently sits at rank #2 by market cap.
Mentioned in this article






Editorial credits