

Quick Take
- Bullish’s July trading volume fell 42.9% year over year, while its average spread widened 72.4%.
- The wider spread kept the volume-times-spread proxy only 1.6% below last year, suggesting activity losses were partly offset.
- June’s much steeper drop still dragged the proxy 38.3% lower month over month, and July figures remain preliminary.


CoinDesk's subsidiary and affiliate Bullish reported a 42.9% year-over-year drop in July trading volume even as its company-defined average trading spread widened 72.4%.
The two figures produced a derived volume-times-spread proxy that remained slightly below its level a year earlier, so the wider spread did not fully counter the loss of activity on that calculation.
The exchange operator reported a total trading volume of $30.7 billion in unaudited monthly metrics released Aug. 6, down 39.7% month over month.
Average trading spread rose to 2.62 basis points from 2.56 basis points in June and 1.52 basis points a year earlier. Multiplying each period’s volume by its spread gives over $8 million for July, compared with $13 million in June and $8.2 million in July 2025.
The derived proxy fell 38.3% month over month and 1.6% year over year. July’s wider spread came close to balancing the year-over-year volume decline in this calculation, but the much larger drop from June remained.
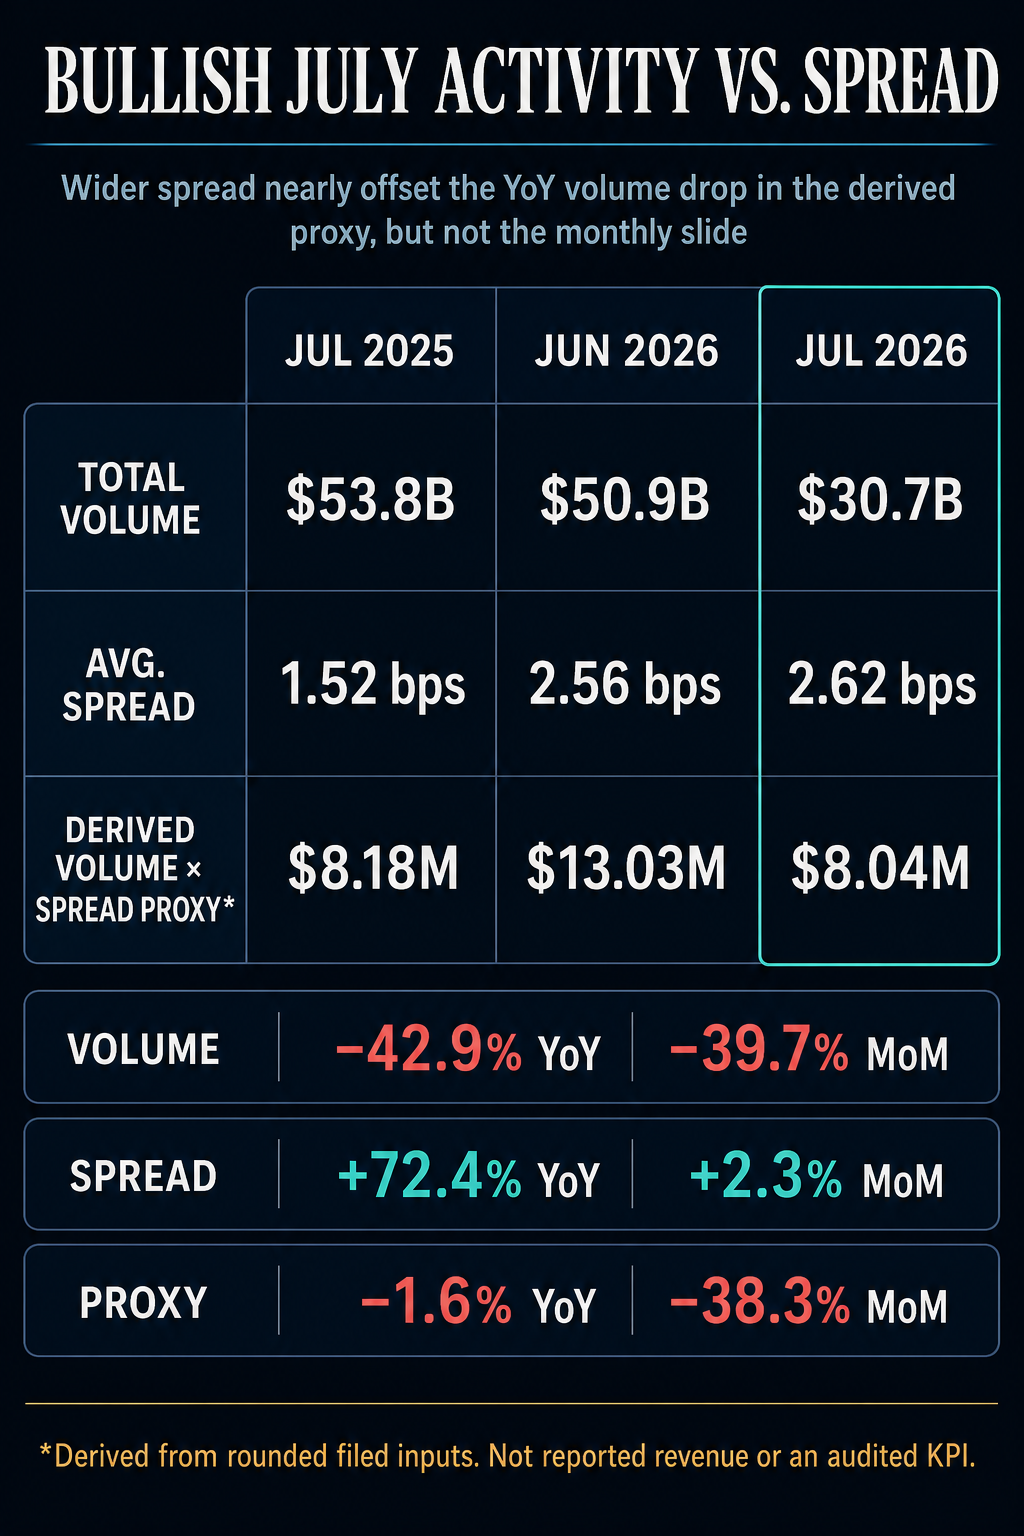
Those dollar values result from multiplying two rounded inputs in the filing and cannot establish the company’s profitability.
Bullish defines average trading spread from commissions relative to volume and says it also reflects changes in the fair value of perpetual futures and rebates. It is consequently broader than a conventional quoted bid-ask spread or a pure fee rate.
Total spot volume fell to $29.1 billion in July from $45.5 billion in June and $48.8 billion a year earlier, declines of 36% and 40.4%, respectively. Within spot trading, Ethereum volume dropped to $3 billion from $4.9 billion in June and $11.1 billion in July 2025, a 73% year-over-year decline.
Bullish defines trading volume as the dollar-equivalent notional value of matched buyer-seller trades executed through its platform. The figure excludes customer assets, balances, and deposits, so the decline alone does not demonstrate customer flight or financial stress.
The company’s annual report provides the CoinDesk relationship used to identify Bullish, and its July package remains the source of the operating data.
Bullish said the monthly package is unaudited and that figures for months in the latest fiscal quarter are preliminary estimates subject to closing procedures.
Final quarterly results may differ, so the July data should be viewed as an early indication of activity rather than of reported financial performance.

Ethereum is -0.69% over the past 24 hours and currently sits at rank #2 by market cap.
Mentioned in this article

Editorial credits