
Quick Take
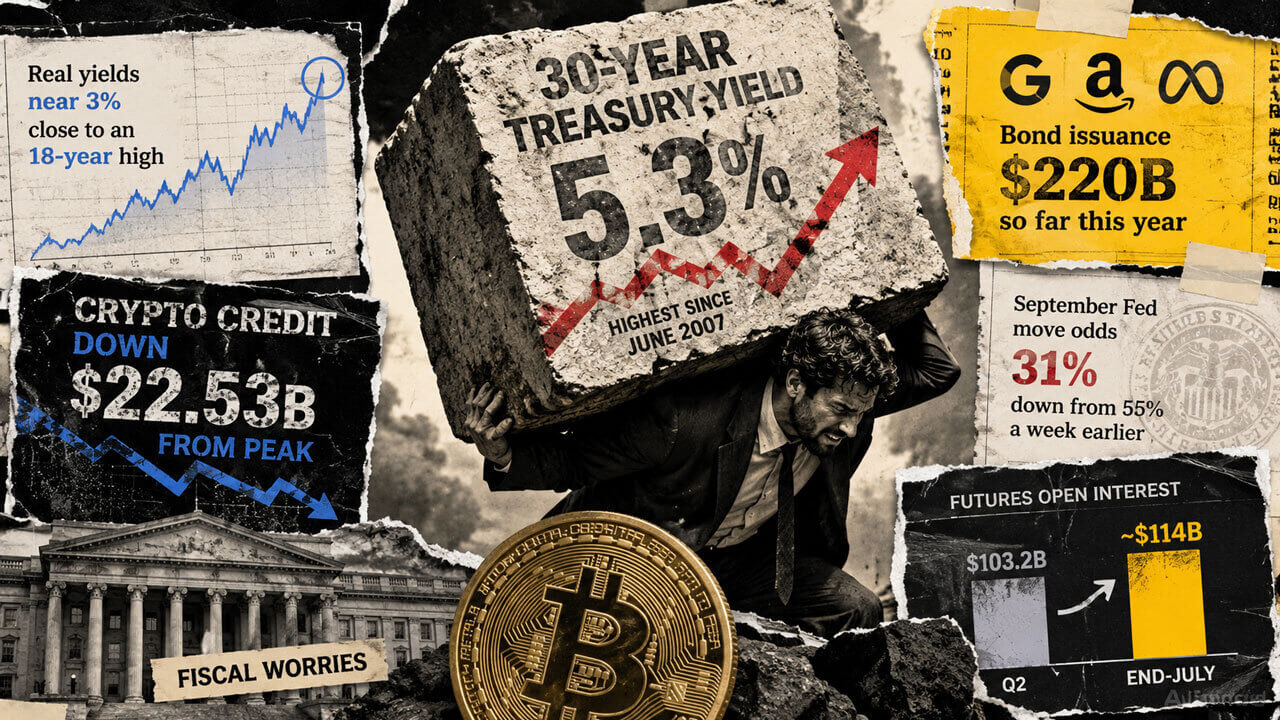
- The US 30-year Treasury yield topped 5.3% as Galaxy said crypto-collateralized lending has fallen $22.53 billion from its peak.
- Higher long yields and heavy bond issuance compete with Bitcoin for capital while it pays no native yield.
- The unresolved question is whether Bitcoin’s next move comes from macro pressure alone or a renewed credit unwind and liquidation cascade.


The US 30-year Treasury yield crossed 5.3% on Aug. 17 for the first time since June 2007, the same day Galaxy published a report showing crypto-collateralized lending down more than $22 billion from its peak. Bitcoin hit an intraday high of $64,610.01 that day.
What makes the Treasury move unusual is its direction against the broader macro picture. Soft economic data this week pushed traders to cut the odds of a September Fed move to about 31%, down from 55% a week earlier, the kind of reaction that usually pulls long yields lower.
The 30-year kept climbing anyway, reaching 5.2954% and as high as 5.314% intraday, putting it on track for its first close above 5.3% in nineteen years.
| Signal | What changed | Read-through for Bitcoin |
|---|---|---|
| Long-end Treasury pressure | 30-year yield crossed 5.3%, highest since 2007 | Raises the hurdle for non-yielding assets like BTC |
| Fed expectations | September move odds fell to 31% from 55% | Shows the pressure is not just a Fed-hawkishness story |
| Real yields | 30-year real yields near 3%, close to an 18-year high | Makes inflation-adjusted Treasury returns more competitive |
| Crypto credit | Collateralized lending down $22.53B from peak | Reduces the leftover credit overhang BTC has to absorb |
| Bitcoin price | BTC traded as high as $64,610.01 | The stress test is happening near a live market level |
A long-duration problem separate from the Fed
Reports tied the move to worries over the US fiscal trajectory alongside heavy AI-related corporate debt issuance. The 30-year real yields are sitting near an 18-year high around 3%, as both governments and AI companies ramp up borrowing at once.
Alphabet, Amazon and Meta alone have issued almost $220 billion in bonds so far this year, more than double the $108 billion the same three companies issued across all of 2025.
That borrowing wave competes directly with Bitcoin for long-duration capital, since investors can now lock in a real, inflation-adjusted return from Treasuries while Bitcoin still pays no yield natively.
Crypto enters this stretch with considerably less collateralized debt than it carried at its last peak.
Galaxy's Q2 2026 leverage report puts crypto-collateralized lending at $56.16 billion, down $11.33 billion in the quarter alone and $22.53 billion below the $78.69 billion high the market reached in the third quarter of 2025.
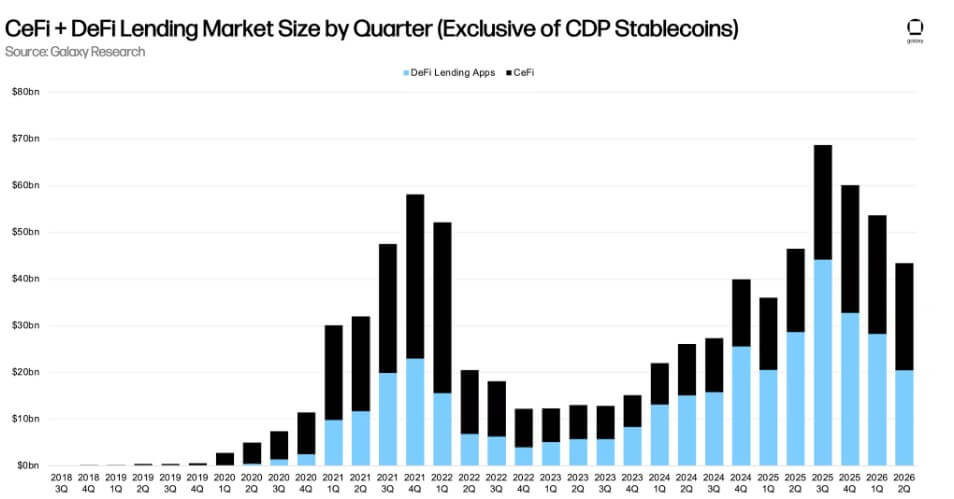
Borrowing on DeFi lending apps fell from a $47.13 billion peak last September to $21.94 billion by July 21, down more than 53%. Total crypto-related debt has now fallen for three straight quarters.
How this unwind compares with 2022
Crypto-backed lending collapsed by more than 55% in a single quarter in 2022. It kept falling another 9% and 29% over the two quarters that followed, as lenders failed and forced liquidations cascaded through the market.
This time the declines have come in steadier steps, roughly 10%, 5% and 17% across three consecutive quarters. Galaxy describes that pattern as gradual risk reduction, a different mechanism than the forced unwind that defined 2022.
The earlier cycle ran on a loop of falling prices, margin calls, and lender failures feeding each other. This one has already done most of its shrinking before the market even faced its current stress.
| Period | Lending decline pattern | Market mechanism | Why it matters |
|---|---|---|---|
| 2022 unwind | >55% in one quarter, then -9% and -29% | Forced liquidations, lender failures, margin pressure | Credit stress amplified price declines |
| Current cycle | Roughly -10%, -5%, and -17% over three quarters | Gradual risk reduction | Less evidence of a lender-driven cascade |
| Current futures market | OI rose from $103.2B to ~$114B by end-July | Faster-moving derivatives exposure rebuilt | Liquidation risk remains, but in a different form |
Galaxy's data shows total futures open interest ending the second quarter at $103.2 billion. It climbed back to roughly $114 billion by the end of July, up nearly $11 billion in a single month. Bitcoin futures open interest alone dipped to about $45 billion during the quarter before recovering toward $48 billion.
Galaxy cautions that open interest is not the same thing as leverage, since some of those positions are hedged against spot holdings and not purely directional bets. Still, the market's shape has changed.
The slow-moving collateralized lending that produced 2022's cascading failures has shrunk considerably, while the faster-moving derivatives exposure that drives sudden liquidation events has been rebuilding.
How Bitcoin's next move reads
If Bitcoin weakens while Galaxy's lending figures keep declining at their current gradual pace, that points toward a macro-driven selloff. High real yields and heavy Treasury and corporate bond supply would be doing the damage on their own, with crypto's unfinished deleveraging playing a minor role at most.
If collateralized lending suddenly accelerates its decline alongside a Bitcoin selloff, or futures open interest collapses abruptly where it would normally just ease, that would look more like the credit-driven cascades of the last cycle.
The bull case has the 30-year retreating below 5.1% or real yields easing off their current highs, giving Bitcoin room to reclaim the $67,000 to $72,000 range. Futures open interest stays roughly stable, and collateralized lending does not re-expand aggressively.
That combination supports the idea that the $22.5 billion credit unwind already completed lets Bitcoin absorb a long-rate shock this severe without repeating 2022.
The bear case has the 30-year pushing toward 5.4% to 5.7% while real yields hold near their multi-decade highs, dragging Bitcoin below $60,000 and toward the $52,000 to $58,000 range.
| Scenario | Treasury signal | Bitcoin signal | Leverage signal | Interpretation |
|---|---|---|---|---|
| Bull case | 30-year falls below 5.1% or real yields ease | BTC reclaims $67K–$72K | Futures OI stable; lending does not re-expand aggressively | Credit unwind helped BTC absorb the rate shock |
| Macro-led bear case | 30-year pushes toward 5.4%–5.7% | BTC loses $60K, tests $52K–$58K | Futures OI drops; liquidations rise; lending declines gradually | Bond market is driving stress, not lender contagion |
| Credit-cascade case | Long yields stay high | BTC sells off sharply | Collateralized lending decline accelerates abruptly | Looks more like 2022-style deleveraging |
| Neutral/chop case | 30-year holds near 5.3% | BTC stays near $60K–$66K | OI eases modestly; lending keeps shrinking slowly | Market absorbs the shock without a clear break |
Futures open interest contracts sharply and liquidations climb, while Galaxy's lending figures keep falling at their current gradual pace without accelerating. That combination would mark the selloff as macro-led and derivatives-amplified, distinct from the lender failures that turned 2022's decline into a cascade.
Bitcoin is walking into a Treasury-rate environment it has never faced before, carrying a credit structure that looks nothing like the one that broke in 2022. Whatever happens next should finally show whether the bond market or crypto's own leverage has been driving Bitcoin's stress all along.

Bitcoin is +1.26% over the past 24 hours and currently sits at rank #1 by market cap.
Mentioned in this article




Editorial credits