


Quick Take
- Glassnode’s October 20 framework emphasizes cost bases near spot, giving Bitcoin’s recovery a more local supply test.
- Proximity MVRV and NUPL express the same price relationship, so stronger support still requires confirmation from actual buying.
- The October 27–28 Fed meeting could alter demand through rate expectations, leaving buyer absorption central to Bitcoin’s recovery.


Bitcoin’s rebound to around $83,500 raises a practical question: how can traders tell whether support is building? Glassnode’s proximity-weighted cost-basis framework looks at the supply positioned closest to the trading price.
CryptoSlate’s Bitcoin market data showed about $83,500, up roughly 2.8% over 24 hours, at 09:44 UTC on Oct. 21. Glassnode’s Oct. 20 explanation of proximity-weighted cost basis, credited to Fountainhead Digital co-founder Vicky Yang, offers a way to assess that nearby inventory. The framework offers a test for the recovery ahead of the Oct. 27–28 Federal Reserve meeting: whether nearby positioning improves as buyers absorb supply.
That distinction was visible in the earlier backdrop. Glassnode’s Oct. 19 market report described 68.2% of Bitcoin supply as being in profit while spot buying remained weak during its reporting window. That earlier combination shows how broad profitability can coexist with weak demand.
The same price can meet different supply
Two visits to a similar price can encounter different inventory conditions. If more of the nearby weighted supply sits below spot on the second visit, the model would show a more supportive distribution. If more sits above it, the same price could face greater potential resistance.
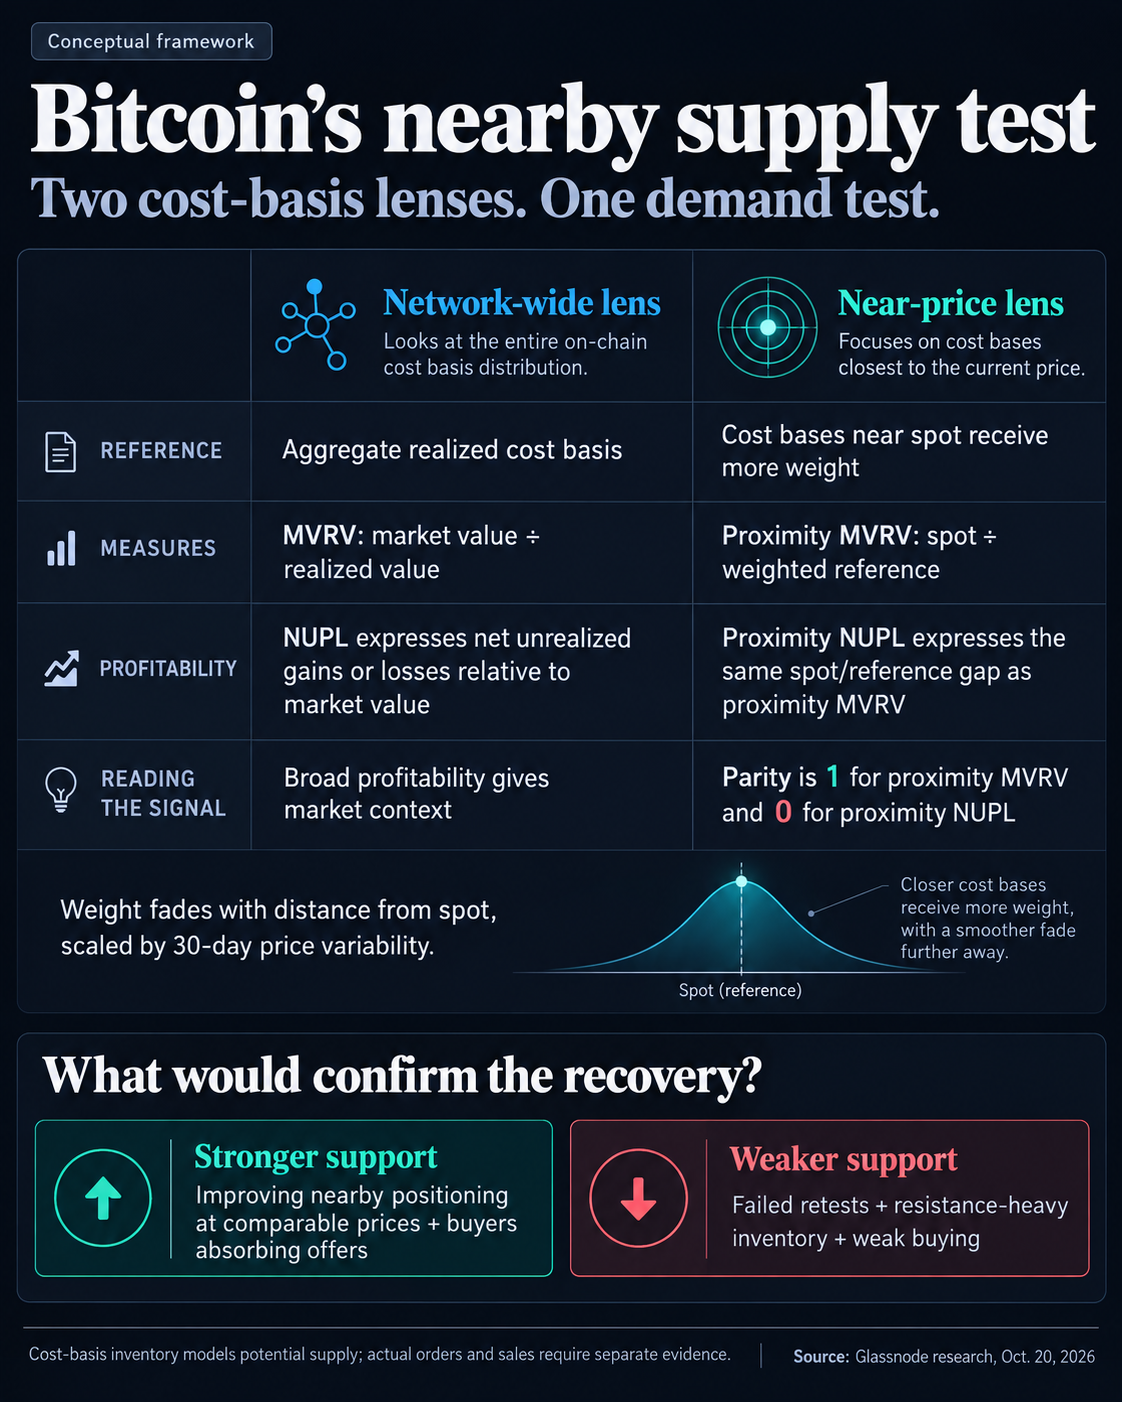
The familiar market value to realized value ratio, or MVRV, divides market capitalization by realized capitalization. It places the market’s valuation against an aggregate cost-basis reference. A reading above one means market value exceeds that reference. Locating inventory relevant to the next price move requires a view of where cost bases sit.
Net unrealized profit/loss, or NUPL, expresses the difference between market capitalization and realized capitalization as a share of market capitalization. It measures the size of net unrealized gains or losses relative to market value. Counting profitable Bitcoin holders or coins requires separate measures; NUPL’s denominator is market value.
For selling risk, the location of cost bases matters. An aggregate profit cushion says little by itself about how cost bases are arranged around the trading price. Supply with a distant cost basis can contribute to broad profitability without describing the economics of inventory nearer spot.
The proximity approach divides the cost-basis distribution into percentile groups, or quantiles, then weights them according to their distance from spot. Weights fall exponentially as that distance grows, with the distance scaled by the 30-day rolling standard deviation of price. The result is a weighted realized-price reference that emphasizes cost bases nearer the trading range.
Volatility changes the lens. Holding spot and cost bases fixed, a larger price standard deviation spreads meaningful weight across a wider distance. A smaller one concentrates weight more tightly. A change in the proximity measure can therefore reflect a change in price or volatility as well as a change in the underlying distribution.
Proximity MVRV divides spot by that weighted realized price. At one, spot equals the reference. Above one, spot exceeds it; below one, spot falls short.
Proximity NUPL expresses the same relationship differently, dividing the difference between spot and the weighted reference by spot. Its corresponding breakeven point is zero. With matched inputs, these are two expressions of one relationship.
The weighting also explains how a smaller proximity profit cushion can arise through the calculation itself. Reducing the influence of distant low-cost supply can narrow the apparent cushion by construction. That is a reason to examine each measure against its own history before describing a reading as unusual. Breakeven here applies to the weighted reference, while individual cost bases and selling decisions can vary.
What would show support building
Glassnode’s Proximity Support Index measures the share of proximity-weighted supply below spot. The complementary Resistance Index covers the share at or above it. A support share above half means the distribution is support-dominant within the model.
These labels describe potential support and resistance. Cost-basis distributions model supply using prices associated with on-chain movements. Those prices are an imperfect proxy for acquisition costs. The resulting inventory map establishes potential pressure, with the volume actually offered still dependent on owners’ decisions. Inventory above spot may become relevant if price rises toward it.
This is why a rally through a modeled reference and a successful retest carry different information. The rally changes the relationship between price and cost basis. A retest, considered alongside actual buying, can help assess whether demand is absorbing supply as it becomes available.
Glassnode’s retrospective examples from 2023, 2025 and 2026 illustrate how similar Bitcoin prices can conceal different nearby inventory structures.
A stronger support interpretation would combine improving proximity positioning at comparable prices with spot buyers absorbing offered supply. If price returned to a familiar area while more of the weighted distribution sat below it, that would suggest a more supportive arrangement. Resilience as supply was offered would give the model an observable demand counterpart.
Repeated failed retests, a persistently resistance-heavy nearby distribution and weak buying would weaken the support interpretation. That combination would suggest the rebound was struggling to absorb potential supply.
The Fed can change the demand side
The Federal Reserve’s official calendar schedules the next FOMC meeting for Oct. 27–28. Policy repricing around that meeting could change the demand available to meet nearby supply.
In an April 2025 speech on monetary transmission, Adriana Kugler explained how policy and communications can affect deposit returns, loan rates and the relative attractiveness of investments.
Expectations about the future path of rates can influence those conditions before a decision. Lower expected cash returns and financing costs could make it easier for demand to absorb available supply, all else equal. Higher expected returns on cash or more expensive financing could make that task harder. The decision’s effect would also depend on what markets had already anticipated and on other flows.
For Bitcoin around $83,000, the supply test remains the same whichever way rate expectations move: whether improving nearby positioning is accompanied by buyers able to absorb offers.

Bitcoin is +2.22% over the past 24 hours and currently sits at rank #1 by market cap.
Mentioned in this article

Editorial credits