

Quick Take
- August US inflation rose 0.4% month on month, keeping monetary policy central to Bitcoin’s next test.
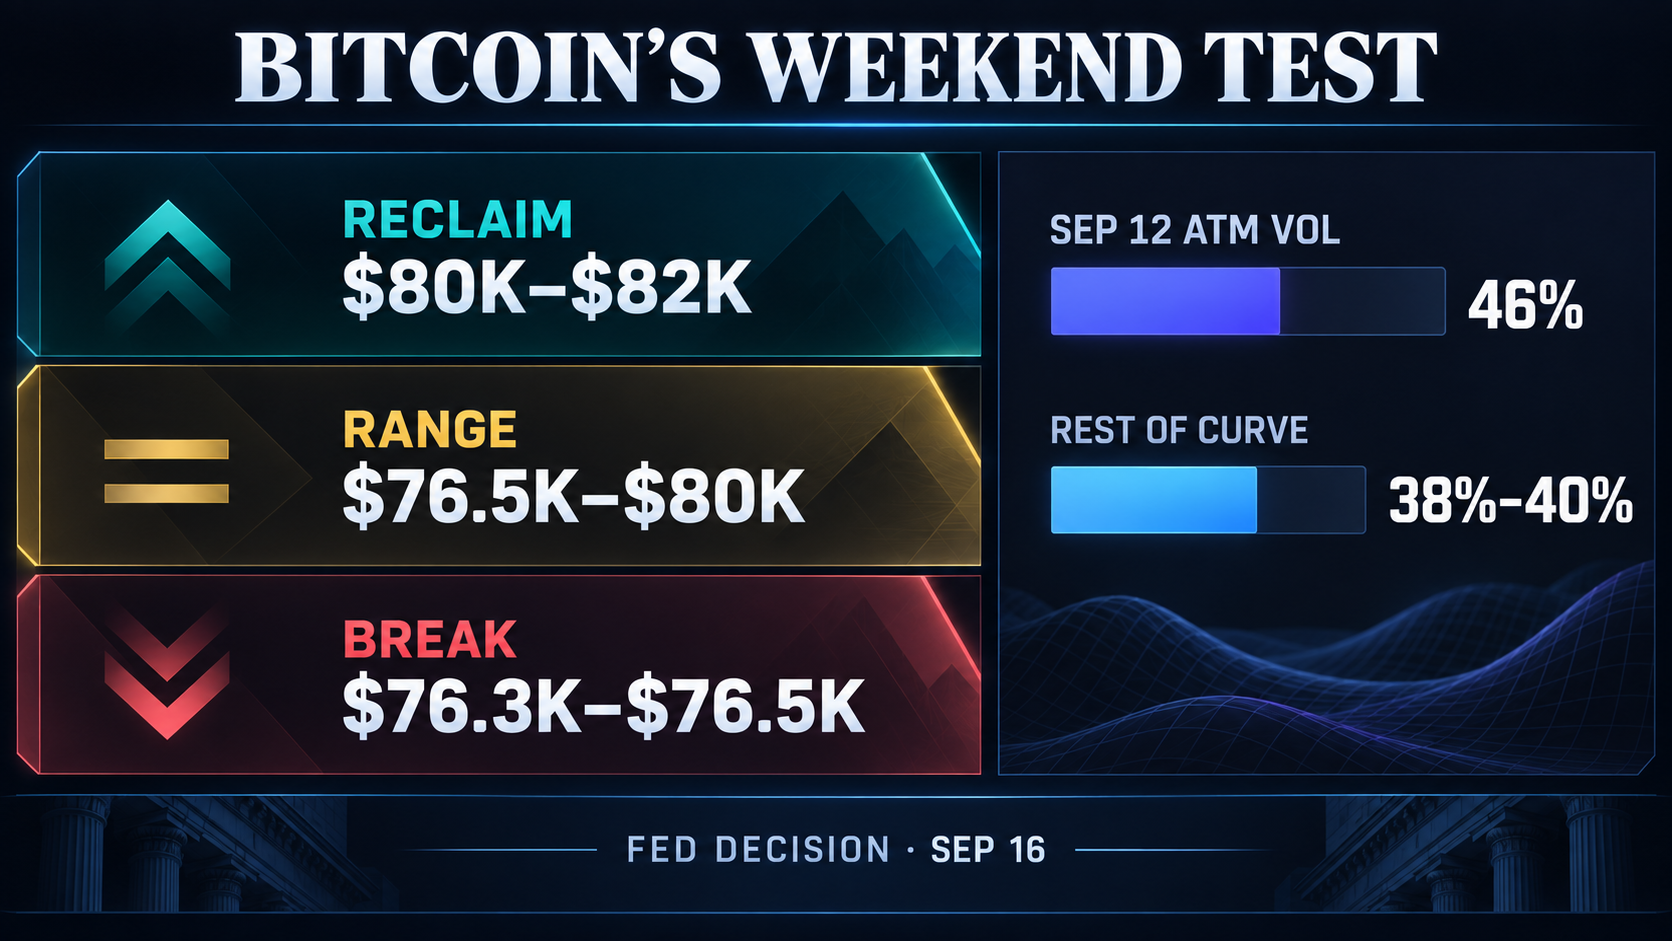
- QCP put Sept. 12 Bitcoin options volatility near 46%, versus 38%-40% across the rest of the curve.
- Wednesday’s Fed decision will test whether Bitcoin’s weakness persists, with a range break clarifying the recovery’s strength.


Bitcoin failed to break $80,000 on Sept. 11 as US stocks climbed about 1% and long-dated Treasury yields stayed near levels not seen in years.
Bitcoin registered an intraday high of $79,890, still short of the $80,000-$82,000 resistance zone identified by digital asset trading firm QCP. The S&P 500 closed up nearly 1%, while the Dow and Nasdaq followed closely.
That split is not proof that Bitcoin has decoupled from macro conditions yet or that sellers around $80,000 have become the dominant market force. Nevertheless, Bitcoin still has to show it can reclaim the level that has capped its recent advance.
Bonds eased from their peaks, but conditions stayed tight
August core CPI rose 0.3% on the month, keeping the Fed decision central to Bitcoin’s weekend setup.
The 10-year yield briefly touched 4.9915%, its highest level in almost three years, while the 30-year reached 5.424%, a 19-year high. The yields later pulled back to roughly 4.95% and 5.341%, respectively.
The move left the 10-year yield near 5%, maintaining a demanding backdrop for risk assets. Markets priced about an 85% probability of a quarter-point Fed rate increase the following week.
Bitcoin’s weaker showing narrowed the weekend question: was the cryptocurrency only lagging an equity rebound, or was resistance near $80,000 becoming an obstacle in its own right?
The options market sets a two-level test
QCP reported that the Sept. 12 Bitcoin options expiry carried at-the-money implied volatility near 46%, compared with roughly 38%-40% across the rest of the curve.
Turnover was concentrated in Sept. 12 calls at $78,500 and $80,000, and QCP also saw steady demand for $75,000 puts expiring Sept. 11 and Sept. 18.
Call activity kept upside exposure active near spot, while the puts showed that investors were still paying for downside protection.
QCP’s levels reduce the weekend setup to support at the $76,300-$76,500 zone and resistance at the $80,000-$82,000 range.
| Bitcoin outcome | What it could indicate |
|---|---|
| Breaks below $76,300-$76,500 | The case that Bitcoin is merely pausing weakens, placing greater weight on downside protection around $75,000. |
| Stays between roughly $76,500 and $80,000 | Consolidation remains intact, leaving the Fed decision as the more important test. |
| Reclaims $80,000 and pushes into $80,000-$82,000 | Friday’s relative weakness looks more like delayed catch-up than a damaged recovery. |
A weekend break can establish direction, but cannot by itself distinguish macro pressure from Bitcoin-specific selling.
Wednesday’s Fed decision is the verification event
The Federal Reserve’s Sept. 15-16 meeting includes a new Summary of Economic Projections.
The test is whether Bitcoin can sustain a move beyond QCP’s range after the announcement. A break above $80,000–$82,000 would strengthen the recovery case; a loss of $76,300–$76,500 would weaken the consolidation case. Neither outcome alone would establish the cause.

Bitcoin is -0.25% over the past 24 hours and currently sits at rank #1 by market cap.
Mentioned in this article
Editorial credits