

Overview
Introduction
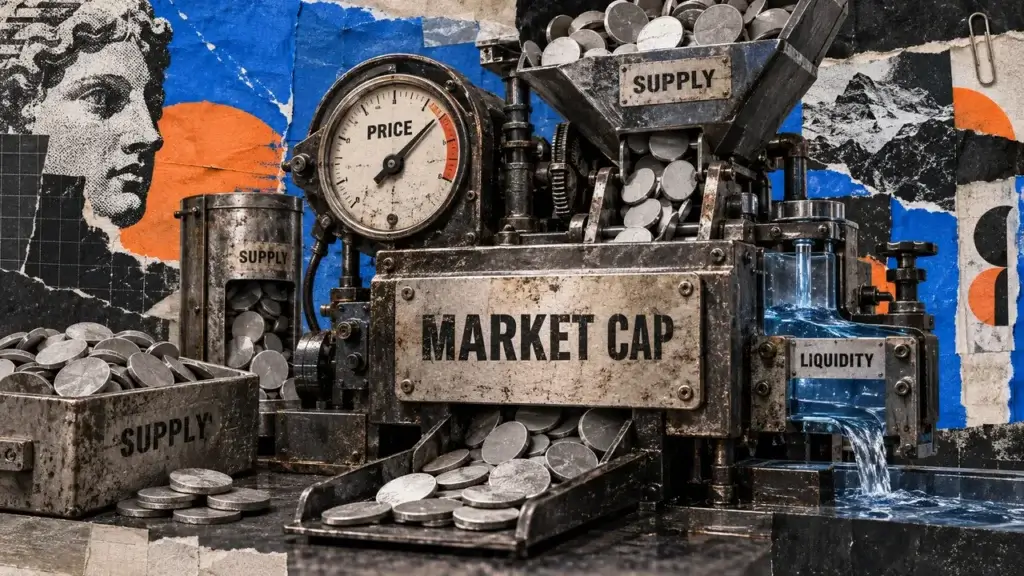
Market cap is a valuation snapshot, not a pool of money. If a token trades at $2 and 100 million tokens are counted as circulating, its market cap is $200 million. If the last price changes to $2.10 with the same counted supply, the displayed cap becomes $210 million.
That $10 million increase does not mean buyers deposited exactly $10 million. A much smaller net flow can move the last traded price, and that price is then applied to every circulating token in the calculation. Understanding that distinction prevents some of the most common mistakes in crypto comparison.
Key takeaways
- What it is. Crypto market cap equals the current unit price multiplied by circulating supply.
- Why it matters. It puts price and supply on one scale, which is more informative than comparing token prices alone.
- Main risk or limitation. Market cap does not measure cash invested, liquidity, fair value or the amount that holders could sell without moving price.
The Crypto Market Cap Formula
The basic formula is:
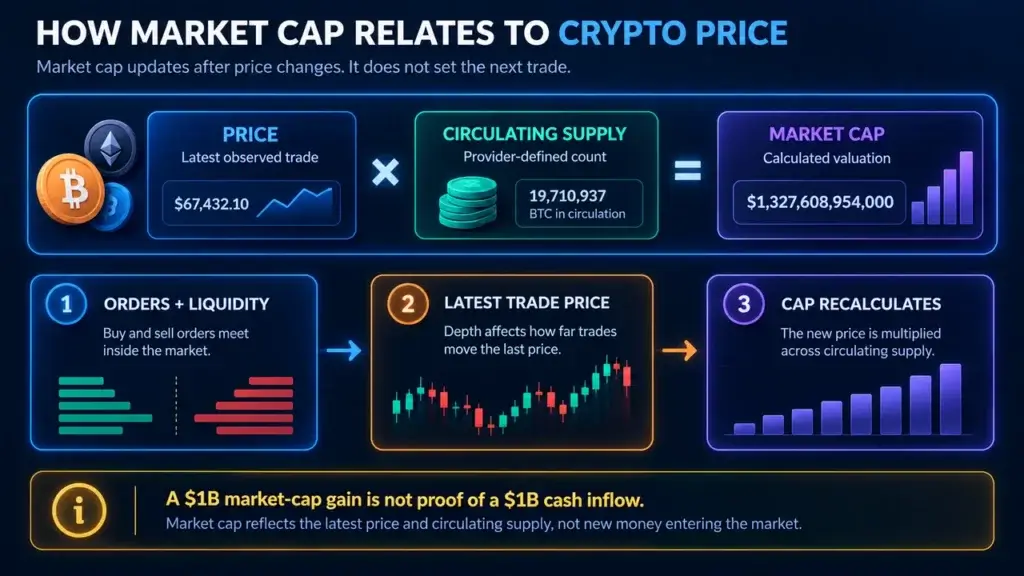
market cap = current price × circulating supply
Coin Metrics' market-cap methodology notes show why the result depends on a defined price and supply series. CryptoSlate's market capitalization definition provides the short version, while this page focuses on what the calculation does and does not imply.
| Unit price | Circulating supply | Market cap |
|---|---|---|
| $100 | 1 million | $100 million |
| $10 | 10 million | $100 million |
| $1 | 100 million | $100 million |
The table shows why a low unit price is not evidence that an asset is cheap. Three assets can have the same market cap at very different prices because their counted supplies differ.
Use live coin supply and valuations to compare current data. Confirm the provider's circulating-supply method before treating two values as perfectly comparable.
Does Market Cap Cause Price to Rise?
Not by itself. Market cap is the result of a price and supply observation. In the short run, trading changes the last traded price, then the calculation updates. A headline that says an asset “added $1 billion in market cap” describes the valuation change. It does not identify a matching $1 billion cash inflow.
The direction can also run through supply. If the circulating count rises while price stays unchanged, market cap rises mathematically. If new supply reaches sellers and demand does not absorb it at the old price, trading can push the price lower. Market cap then reflects both the larger supply and the new price.
The useful question is therefore not “what market cap should make price rise?” It is “what change in demand, available supply and liquidity would be needed for the market to trade at a different price?”
Why Market Cap Is Not Money Invested
The next orders that trade set the observed price. The latest trade establishes a reference price even though only a small fraction of the supply changed hands. Multiplying that reference by circulating supply creates a valuation for the full counted amount.
Assume 100 million tokens circulate and the latest price is $1. The market cap is $100 million. A sequence of buy orders lifts the last trade to $1.10. The new market cap is $110 million. The cap rose by $10 million, but the orders did not need to total $10 million. Their impact depended on how many sell orders were available between $1 and $1.10.
The reverse is also true. A relatively small sell order can reduce the last price sharply in a thin market. Applying the lower price across the entire circulating count can erase a large amount of displayed market cap.
BIS research on the crypto multiplier examines why changes in investor flows can produce larger changes in cryptocurrency market value. The size of the valuation response depends on market structure and holder behavior, not a one-for-one cash rule.
Circulating, Total, and Maximum Supply
Supply terms answer different questions:
- Circulating supply is the amount a data provider counts as available in the market.
- Total supply generally counts existing units after exclusions such as verifiably burned tokens, according to the provider's method.
- Maximum supply is an upper limit when the protocol defines one.
CryptoSlate maintains separate definitions for circulating token supply and total token supply.
The maximum token supply definition covers the upper-bound concept. A project can have a fixed maximum yet a rising circulating supply as locked allocations become transferable.
Bitcoin is an example of a published issuance schedule. Bitcoin.org's halving and supply explanation states that supply approaches a fixed 21 million limit through scheduled block-reward reductions. The live Bitcoin supply record shows current data, while the protocol schedule explains why the circulating amount changes over time.
Other networks use inflation, burns, treasury releases or governance decisions. Comparing only maximum supply can miss the pace and control of actual distribution.
Fully Diluted Valuation and Future Supply
Fully diluted valuation, often shortened to FDV, applies the current price to a larger supply measure such as maximum or total supply. It is a scenario, not a promise that all units can be sold at today's price.
FDV = current price × assumed fully diluted supply
Assume a token trades at $4, has 25 million units circulating and a maximum supply of 100 million. Its market cap is $100 million and its maximum-supply FDV is $400 million. The difference highlights 75 million units outside the circulating count, but it does not tell when they become available, who receives them or whether demand changes first.
The schedule matters more than the gap alone. A large supply release next month creates a different market question from the same amount released over ten years. A token lockup definition explains the restriction, but analysis still needs the actual vesting contract or official allocation schedule.
How Token Releases Can Affect Price
A scheduled release makes previously restricted units transferable. It does not guarantee that recipients sell. Price impact depends on several linked factors:
- How large is the release relative to circulating supply and normal volume?
- Who receives the tokens and what incentives do they have?
- Was the schedule already public and expected?
- Can recipients hedge before the release, allowing them to reduce exposure before the tokens become transferable?
- How much buying interest and order-book depth exist near the current price?
If a release is fully expected, some effect may appear before the date as traders adjust. If recipients retain or stake the tokens, immediate sell pressure may be limited. If they sell into weak depth, price impact can be material.
The Solana market profile and Ethereum supply data illustrate why supply systems need asset-specific reading. Do not carry assumptions from one network into another.
Liquidity Determines the Path From Flows to Price
Market cap says nothing about how much can trade near the quoted price. Liquidity depends on available orders, market-maker activity, exchange distribution and the size of the proposed trade.
Two tokens can each show a $500 million cap. One may trade across several deep exchanges with narrow spreads. The other may have little genuine volume and most supply in a few wallets. Selling $1 million can have very different price effects.
Guides to liquidity and trade execution and liquidity-provider quoting mechanics add the execution layer that the market-cap number omits.
Centralized cryptocurrency exchanges differ in pairs, access and depth. Before sizing an order, check the depth and available pairs on the specific exchange you would use.
Comparing Crypto Assets by Market Cap
Market cap is better than unit price for a first size comparison, but it is not a ranking of investment quality. A fuller comparison asks:
- Is circulating supply measured consistently?
- What share of total or maximum supply is already circulating?
- Which unlocks, emissions or burns can change that share?
- How concentrated is ownership?
- How deep are the main exchanges?
- What gives the token demand beyond speculative resale?
- Does project activity create value for the token itself?
- Who holds the keys or governance rights that can change issuance or distribution?
Comparison also needs a common economic function. A stablecoin's market cap describes the amount counted in circulation, but a price materially above or below its target can signal a peg problem rather than ordinary growth. A governance token may have a large cap without giving holders a claim on protocol revenue. A fee token can be necessary for network use, yet its price still depends on issuance, fee design and whether users must hold it for long. Putting those assets in one size ranking is useful for orientation, but the ranking does not make their demand, cash-flow rights or supply risks comparable. Match the valuation measure to what the token actually does.
A complete cryptocurrency analysis combines those questions. On-chain supply evidence can test holder distribution and movement, subject to how reliably addresses can be attributed to their owners.
A Worked Price and Supply Scenario
Consider a fictional token with 50 million units circulating at $2. Its starting market cap is $100 million. Another 10 million units are released, increasing the circulating count to 60 million.
| Scenario | Price | Circulating supply | Market cap |
|---|---|---|---|
| Before release | $2.00 | 50 million | $100 million |
| Supply rises, price unchanged | $2.00 | 60 million | $120 million |
| Price falls 15% | $1.70 | 60 million | $102 million |
| Price falls 25% | $1.50 | 60 million | $90 million |
The table does not predict which path occurs. It separates the accounting from the market response. The second row is the direct mathematical effect of changing the counted supply. The later rows illustrate possible prices after trading. Actual price depends on expectations, sales, demand and liquidity.
Notice that a 15% price decline still leaves market cap slightly above the starting value because more units are counted. This is one reason price and cap can tell different stories during periods of rapid issuance.
Common Market Cap Mistakes
Calling a Low-Priced Token Cheap
Unit price has no meaning without supply. Compare market cap, dilution and value creation.
Treating Market Cap as Cash in the Asset
It is price multiplied by supply, not accumulated deposits.
Ignoring Supply Methodology
Data providers may disagree about treasury, locked, bridged or inactive units. Read the definition.
Comparing FDV Without Time
The same FDV gap can imply very different dilution depending on the release schedule.
Assuming Every Release Is Sold
Transferability creates potential supply. Holder behavior determines actual selling.
Forgetting Liquidity
A high cap can coexist with shallow depth. Why crypto prices move sharply explains how weak depth can amplify price change.
Where to Go Next
- How token burns work explains what supply reduction can and cannot change.
- Crypto market trend coverage adds current context without changing the formula.
- Broader fundamental analysis places market cap inside a wider research method.
- Trading depth and execution shows how marginal orders set the observed price.
- Current analytical research covers time-sensitive supply and market events.
Frequently Asked Questions
Does a higher market cap mean a higher coin price?
No. Market cap is unit price multiplied by circulating supply, so a large cap can sit on a low unit price when supply is large and a small cap on a high price when supply is small. Compare the full calculation instead of unit prices alone.
How much money is needed to raise crypto market cap?
There is no fixed one-to-one amount. Buy orders move the last traded price through available sell liquidity, then that price is multiplied by circulating supply. The required flow depends on order-book depth, market-maker response, how liquidity is split across exchanges and holder behavior.
Can market cap increase when price falls?
Yes. If circulating supply increases enough, market cap can rise even while unit price falls. For example, a 20% supply increase and a 10% price decline produce a higher cap. The result describes valuation arithmetic and does not by itself show whether holders gained.
Is fully diluted valuation more important than market cap?
Neither number is sufficient alone. Market cap describes the current price applied to circulating supply. FDV applies the price to a larger assumed supply. Read them with the release schedule, recipient distribution, demand, liquidity and the rules that control future issuance.
Do token burns always increase price?
No. A burn reduces a supply measure under defined conditions, but price still depends on demand, expectations and liquidity. The market may already expect the burn, the amount may be immaterial or declining use may outweigh the supply reduction.