

Overview
Introduction
Crypto price predictions estimate a cryptocurrency's future price, direction or price range over a stated period using data and assumptions available when the forecast is made. A target of $150 could be a model's central estimate or an analyst's optimistic scenario. Learning how to predict crypto prices starts with the question that number answers: which asset, at what time, under what assumptions?
Key takeaways
- What it is. A crypto price prediction estimates a future price or direction over a defined horizon using specified data and assumptions.
- Why it matters. Matching the price reference, target time and output type makes forecasts comparable across different publishers.
- Main risk or limitation. An optimistic price estimate can conceal substantial downside along the path to the forecast date.
What Makes Crypto Price Predictions Testable?
A cryptocurrency price prediction needs an outcome that can eventually be checked. “Bitcoin looks bullish” is market commentary. “The specified Bitcoin spot reference will close above today's value in 30 days” is a directional forecast with a measurable result.
Even that statement needs a little more detail. Crypto trades continuously, so a daily close depends on a cutoff. A USD index and the last trade in a thinly traded pair are different reference prices. Write the measurement convention beside the prediction.
| Forecast field | What to record | Why it changes the question |
|---|---|---|
| Asset and quote | Exact coin or token, quoted in USD or another currency | A token can rise against dollars while falling against Bitcoin |
| Price reference | Named index, exchange pair or other defined source | Different markets can print different prices |
| Forecast origin | Publication timestamp and data cutoff | Later information must not enter an earlier forecast |
| Target and horizon | Exact target timestamp and elapsed period | A 30-day outcome is different from a calendar month-end outcome |
| Output | Price, direction, range or event probability | Each requires a different accuracy test |
| Revision rule | When updates occur and where old versions remain | A moving target can conceal an unsuccessful original call |
The distinction between a quoted price and a price available for an actual trade also matters. Liquidity in a trading market affects how much an order can move the execution price. A forecast can be evaluated against a published reference without implying that everyone could buy or sell at that reference.
How to Predict Crypto Prices From Stated Assumptions
Crypto price prediction methods differ in the information they use and the relationships they assume. A price chart can describe recent behavior. A token schedule can describe issuance. Neither supplies a future price until someone connects those observations to a forecasting rule.
Market Prices and Trading Activity
Technical approaches use past prices, returns and trading volume to identify patterns or estimate future movements. The assumption might be that a recent trend persists, or that an unusually large move partly reverses. These are competing hypotheses to test, not interchangeable reasons to expect a gain.
Order book bids and asks add information about displayed demand and supply near the current price. That information can change as orders are filled or canceled. A forecast for next month should explain why a short-lived observation is relevant across that longer period.
Asset Economics and Token Supply
Fundamental analysis of an asset examines its economic purpose, adoption and value drivers. For a token, the crucial extra question is how activity creates demand for the token itself. More use of an application does not automatically imply that its token holders receive more value.
Supply assumptions must also match the target date. A forecast using today's units could misstate a future per-token value if issuance or unlocks change the circulating supply at the horizon. The relationship between market capitalization and token price can expose an implausible valuation assumption, but it does not prove that a plausible valuation will occur.
Bitcoin's remaining issuance schedule narrows the supply question, while future demand still has to be estimated. Bitcoin.org's price explanation identifies supply and demand as the relevant market forces, not a guaranteed appreciation rate.
Network Activity and Market Sentiment
Blockchain transactions, fee activity and address counts can inform a forecast, provided their definitions are understood. An increase in addresses need not represent an equal increase in people. Coin Metrics' address definitions illustrate why the unit being counted matters before drawing a demand conclusion.
News, surveys and fear and greed indicators describe other aspects of market behavior. A sentiment reading may move in response to price, which complicates claims that it predicts price. Several indicators reacting to the same rally do not necessarily provide several independent pieces of evidence.
Statistical and AI Models
Statistical models and machine learning turn selected inputs into forecasts through explicit mathematical rules. Cryptocurrency forecasting might use past returns alone or combine prices with network and market variables. The output depends on the target, training period and modeling choices.
An AI label does not identify what was predicted or how well it worked. A model trained to classify tomorrow's direction is not automatically a model of next year's dollar price. The method's name should never substitute for its input definitions and evaluation record.
Price Targets, Ranges, and Scenarios Are Different Outputs
A point forecast gives one value. It may represent a mean, a median or another chosen estimate. These summaries can differ, especially when the possible outcomes are unevenly distributed. Check which one the publisher uses before comparing two headline targets.
A prediction interval adds a probability statement about a future observation under the model. An analyst's scenario instead asks what might happen under a specified set of conditions. Hyndman and Athanasopoulos describe scenarios as forecasts built around plausible future circumstances and documented drivers.
| Published output | What it tells you | What it does not establish |
|---|---|---|
| Central price estimate | One summary of the forecast outcome | A guaranteed destination or a safe entry price |
| Central 80% prediction interval | The middle 80% of the model’s forecast distribution | The full set of possible prices or proven real-world coverage |
| Bull/base/bear scenarios | Outcomes conditional on different assumptions | Equal probabilities, or any probabilities unless supplied and justified |
| Fixed-growth calculator | The arithmetic consequence of an entered growth rate | Evidence that the chosen growth rate will occur |
A fair-value estimate introduces another distinction. It describes a valuation under a chosen framework. Turning it into a dated market-price forecast requires an additional argument about whether, and when, the market will converge toward that valuation.
Likewise, the probability of briefly touching a threshold during a month is not the probability of finishing the month above it. Event definitions belong beside any probability, even when a familiar coin name appears in both questions.
Build a Scenario Without Inventing Certainty
Suppose a hypothetical token is expected to gain users over the next quarter. Begin by separating the observation from the assumption. A measured increase in activity last quarter is an observation. Continued growth next quarter is an assumption. Increased demand for the token is a further assumption that needs its own explanation.
Write down what would connect those steps. Perhaps the token is required to pay for a service, but each service interaction uses very little of it. Perhaps users can immediately obtain and sell it. Those design details affect the demand argument even if the application becomes more popular.
A short scenario record could look like this:
| Scenario | Assumption for the next quarter | Evidence that would challenge it |
|---|---|---|
| Continuation | Usage and token-demand patterns remain broadly similar | A change in how the service charges or accepts payment |
| Weaker demand | Activity declines or requires fewer tokens per interaction | Sustained growth in measured token demand despite the decline |
| Higher demand | Adoption increases demand for tokens without an offsetting supply change | More activity but flat token demand, or unexpected additional supply |
These are hypothetical conditions, not computed price targets. Assigning dollar figures would require another explicit relationship between the assumptions and price. Labeling the rows “bear,” “base” and “bull” would not supply that relationship.
Preserve the record before the quarter begins. State which observations would prompt a revision, then distinguish a revised scenario from the original. If the token's economic design changes, a valuation estimate based on the old design may need to be withdrawn.
Read the Forecast Date Before the Forecast Line
Consider a fictional asset priced at $100 on Day 0 at 00:00 UTC. An illustrative model gives a median of $108 for Day 30 at 00:00 UTC, with a central 80% interval from $75 to $140. These figures are invented to explain the display, not calculated from market data.
The median implies an 8% increase from the reference price. The interval spans endpoint changes of −25% to +40%, and the model still allows outcomes outside it. Under this central interval, each tail contains 10% of the model's probability. That allocation describes the model, not a verified success rate.
Forecasting: Principles and Practice explains why a prediction interval carries information that a single estimate omits. Its width and probability level belong together. Comparing one service's 50% range with another's 95% range does not reveal which is more confident or accurate on a like-for-like basis.
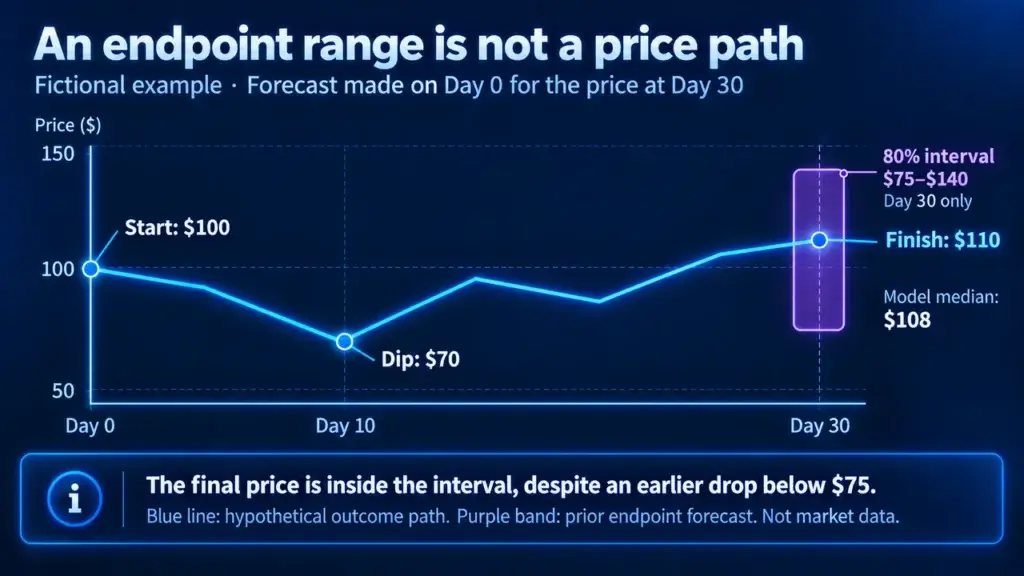
Now suppose the asset drops to $70 on Day 10 and finishes at $110 on Day 30. The final observation falls inside the displayed interval. The earlier drop below $75 does not contradict an interval defined only for Day 30.
It could still have serious consequences for someone holding a leveraged position. Margin calls and forced selling depend on account conditions along the way, not just the eventual closing price. A forecast about the endpoint cannot answer every question about the path.
Why Published Predictions Disagree
Two services can publish different targets without making contradictory claims. One may use yesterday's price as its reference and another today's. One may show a central estimate while the other selects an optimistic scenario. A one-year horizon measured from publication also differs from the end of the calendar year.
Start by aligning those definitions. Then compare assumptions about supply, demand and the persistence of recent market behavior. A fixed-growth projection and a model incorporating changing uncertainty can diverge even when their starting prices match.
Price differences across crypto exchanges make it important to identify the reference used for both the original forecast and the eventual outcome.
Finally, check whether the uncertainty estimate has changed. The volatility of market returns can differ across periods. A narrow range based on a quiet sample may fail to represent a more turbulent period. Disagreement is a reason to examine assumptions, not to average every available target into a supposedly reliable consensus.
Check the Record Behind an Accuracy Claim
“Accurate” needs a defined test. A forecast can correctly predict direction while missing the size of the move. A price estimate can finish close to the outcome without producing a profitable trade after costs. Evaluate the claim the publisher actually made.
For point forecasts, a useful starting comparison is the last observed price. The textbook's simple forecasting methods include this naive benchmark. If a complex model cannot improve on it under the same evaluation conditions, complexity alone has not demonstrated additional forecasting value.
Ask for the asset set, forecast horizon, test dates, error measure and number of completed forecasts. Hyndman and Athanasopoulos distinguish errors on future observations from how closely a model fits its training data. A persuasive historical fit can coexist with poor forecasts.
The test must preserve information order. Data published after a forecast's origin could not have informed the original decision. Time-series cross-validation evaluates successive forecasts using information available earlier, with the evaluation horizon matched to the intended task. Detailed model testing belongs alongside the methodology, not hidden behind a single accuracy percentage.
For ranges, ask how often completed outcomes landed inside them and how wide they were. A range so broad that almost everything fits may provide little useful discrimination. Distributional forecast evaluation considers interval width and misses together. A nominal 80% interval should not be described as empirically reliable merely because one outcome fell inside it.
Separate historical simulations from forecasts archived before real outcomes occurred. Examine losing calls, revisions and discontinued assets as well as successes. A short live record cannot establish how a method performs through conditions it has not yet encountered.
Using CryptoSlate's Coin Data and Forecasts
Cryptocurrency prices and supply data provide a starting reference for identifying the asset, quote and valuation context. Confirm that the data timestamp is appropriate for the forecast being discussed. Today's price should not silently replace the original reference when calculating an older prediction's implied return.
Suppose you are comparing a saved forecast with Bitcoin's current market data. First record the original snapshot time and target date. If the target has not arrived, the current price is an interim observation. It cannot settle whether the endpoint prediction succeeded.
A comparison with Ethereum's market data and forecasts needs the same horizon and probability level to be meaningful. Compare each asset's forecast return with its own starting price. Dollar differences alone give a distorted comparison between assets with different unit prices.
When a forecast display includes a median and intervals, inspect them together. Review diagnostics and completed history where available, noting the sample size and any stated limitations. Keep a copy of the snapshot being assessed so that a subsequent update does not replace it in the comparison. Do not infer forecast coverage from an asset's presence in the coin listings or assume that a new long-horizon prediction already has a completed live outcome.
What to Check Before Acting on a Forecast
A forecast can inform research without determining whether a particular trade is suitable. Before treating a published target as actionable, check these points:
- Can the exact outcome be identified from the asset, price source and target time?
- Does the publisher distinguish observed data from future assumptions?
- Is the number a central estimate, scenario, calculator result or event probability?
- Are uncertainty, original versions and unfavorable outcomes visible?
- Does the evaluation use comparable horizons and a stated benchmark?
- Could the path to the outcome cause losses or forced closure before the target date?
Execution adds a separate set of constraints. Crypto exchange fees and features affect the cost and practicality of a trade, even when the forecast direction is correct. Bid–ask spreads, slippage and any borrowing or funding charges are not automatically included in a model's headline price return.
The CFTC's virtual currency advisory warns about volatility and the way borrowed exposure can increase losses. An upward central estimate does not remove those risks. It also does not establish how much money someone can afford to lose, their investment horizon or their need for access to funds.
If the forecast cannot answer the basic comparison questions, record the missing information before relying on it. A price target with unexplained assumptions remains an unsupported number, regardless of how precisely it is displayed.
This content is educational and does not provide personalized investment advice. Cryptoassets can lose substantial value, and forecasts do not guarantee future results.
Frequently Asked Questions
How to predict which crypto will go up?
Define the asset set and time horizon, choose relevant price, economic or network inputs, and test a stated forecasting rule on subsequent outcomes. Distinguish predicting direction from predicting the size of a move. Neither an optimistic project narrative nor a recent price rise establishes which asset will appreciate next.
Who is the most accurate crypto predictor?
A defensible comparison needs the same assets, horizons, time period and accuracy measure, with original forecasts preserved. Results from different tasks cannot establish a universal winner. A service’s selected successful calls or self-reported percentage is insufficient to make that ranking.
Are crypto price predictions accurate?
Their performance depends on the method and the task. Check completed forecasts against a simple benchmark and distinguish historical tests from live results. Accuracy measured over one asset or period may not carry over to another. A forecast can also get the direction right while substantially missing the eventual price.
Can AI predict crypto prices?
AI can generate estimates from historical and other input data. Whether those estimates add useful predictive information requires testing. The model must use information available at the forecast time and be evaluated on the intended horizon. Producing a precise number is not itself evidence of predictive skill.
Is an 80% prediction range a guarantee?
No. It represents an assigned probability under a model, with some outcomes outside the range. Its real-world reliability requires evaluation across completed forecasts. Also check whether it refers to the price at a target time or an entire path. An endpoint range does not promise that prices stay inside it beforehand.