


Overview
Introduction
AI can find relationships in crypto market data and turn them into forecasts. It cannot know a future price with certainty. A model may estimate tomorrow's closing price, the chance of a positive return, or a range of possible outcomes. Each is a different problem with different ways to judge success.
A forecast deserves attention only if it beats a simple baseline on data it could not have seen, after realistic costs and in more than one market condition. The model's use of artificial intelligence, a polished chart or an exact dollar target does not establish that record.
Key takeaways
- What it is. AI crypto price prediction turns historical features into a defined forecast for a stated asset and time horizon.
- Why it matters. A chronological test can show whether a model adds information beyond a simple baseline.
- Main risk or limitation. Data leakage, overfitting and market change can make an impressive backtest fail in live use.
What an AI Crypto Model Can Predict
A forecast needs a target before it needs an algorithm. Common targets include:
- the next period's closing price
- the percentage return over a fixed horizon
- whether the return will be positive or negative
- the probability that price crosses a defined level
- a range that is intended to contain the future outcome
- expected volatility instead of direction
These targets are not interchangeable. A model can predict direction correctly and still produce a poor price estimate. It can estimate volatility well while having no useful view on whether price goes up or down. A forecast should name the asset, exchange or price source, timestamp, horizon, target and units.
Readers can compare the output with CryptoSlate's live coin data, but the live value should never be substituted for the historical price available when the forecast was made. That would give the model information from the future.
The Data Behind Crypto Forecasts
Price and volume are common inputs because they are widely available and consistently timestamped. A model might derive returns, rolling volatility, moving averages, momentum or order-book imbalance from them. The structure of crypto order books matters when features use bids, asks or depth because those observations can change faster than daily candle data.
Other possible features include funding rates, open interest, liquidations, blockchain activity, macro variables, search interest and text sentiment. More features do not automatically improve a forecast. Each additional field creates another way to introduce missing values, timestamp errors, revised data or accidental access to the target.
Data also needs a clear source policy. Bitcoin prices can differ between exchanges at the same moment. Volume on one exchange is not total market volume. A social signal collected after a price move cannot be used to predict the move. A blockchain label added months later was not available on the prediction date.
The Bitcoin market record and Ethereum price history show why a long sample can span very different liquidity, participant and regulatory conditions. A model trained across the full history may average together relationships that no longer behave the same way.
Common Model Families
Linear and logistic regression provide useful starting points. They are easier to inspect and can reveal whether a complicated system is adding value. Tree-based models can capture nonlinear relationships and interactions. Neural networks include designs built for sequences with many inputs. Language models can classify text or help construct features, but a conversational answer is not a validated price model.
The model family does not determine forecast quality. A complex network can memorize noise. A simple rule can perform well during a persistent trend and fail when the trend turns. Model choice should follow the target, data frequency, sample size and expected use.
That is why a baseline is essential. Reasonable baselines include “the next price equals the current price,” the recent average return, a simple moving-average rule or a fixed class probability. If the AI model cannot beat the baseline out of sample, its complexity has not earned a place in the decision.
Why Time-Series Validation Is Different
Randomly shuffling observations is usually wrong for a market forecast. It can put later observations in the training set and earlier observations in the test set. The official TimeSeriesSplit documentation describes chronological splits because ordinary cross-validation can otherwise train on future data and evaluate on the past.
A walk-forward test respects time:
- Train on an initial historical window.
- Predict the next unseen window.
- Move forward and add only information available by that date.
- Retrain or update according to a rule written in advance.
- Collect every unseen prediction into one test record.
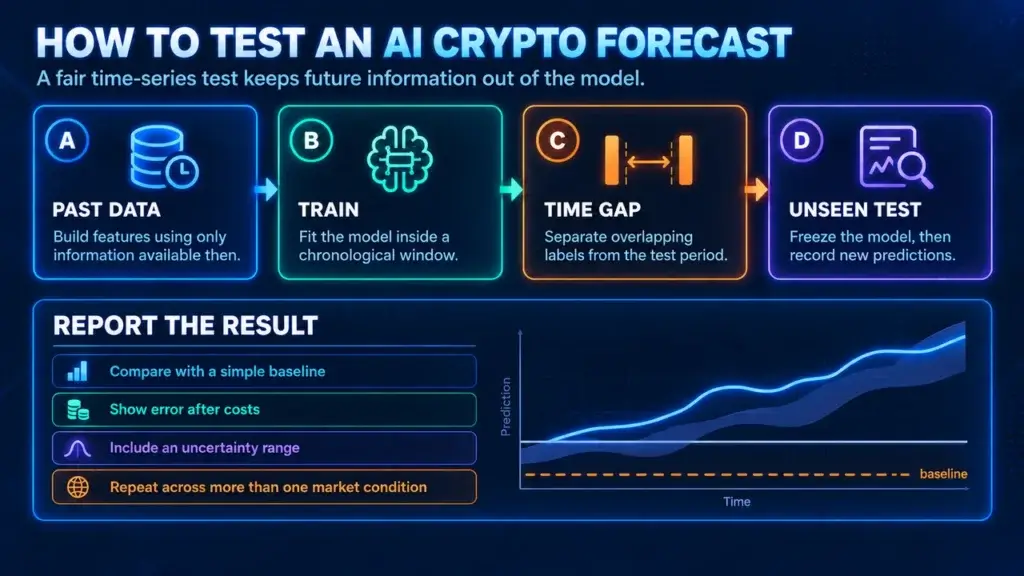
A gap may be needed between training and test periods. If the target is a seven-day return, labels near the boundary can overlap with prices inside the test window. The gap keeps that shared future interval out of training.
The final holdout should remain untouched while features and settings are chosen. Repeatedly checking the holdout and adjusting the model turns it into training data by another route.
The same test record should compare the model with its baseline and show an uncertainty range for the reported result.
A Worked Walk-Forward Example
Consider a hypothetical daily model that forecasts the seven-day return, with direction taken from the sign of that forecast. It is tested on 400 unseen predictions collected through a walk-forward process and compared with a recent-average-return baseline.
| Test result | AI model | Recent-average baseline |
|---|---|---|
| Directional accuracy | 54% | 52% |
| Average absolute return error | 5.8 percentage points | 6.0 percentage points |
| Worst 100-prediction segment | 46% direction | 51% direction |
| Positive calls | 68% of predictions | 74% of predictions |
| Actual higher closes | 54% of outcomes | 54% of outcomes |
The AI result is better on two headline metrics, but the advantage is small and unstable. Both methods make positive calls more often than the asset actually closes higher: 68% for the model and 74% for the baseline, against 54% of outcomes. Raw accuracy may therefore partly reflect class balance rather than a durable forecasting edge. The weak segment shows that the model can underperform for months even when its full-test accuracy is above the baseline.
The next step is not to call the model accurate. It is to test whether the difference is statistically and economically meaningful, whether the same rule survives costs, and whether performance persists across assets and different market conditions. The effects of crypto volatility should be examined separately because forecast error tends to grow as market volatility rises.
How to Measure Prediction Accuracy
For price or return forecasts, common error measures include mean absolute error and root mean squared error. The first averages the size of the miss. The second gives large misses more weight. Percentage errors need care near zero and when comparing assets with very different volatility.
For up-or-down predictions, accuracy can be misleading if one class dominates. Precision, recall, balanced accuracy and a confusion matrix show which kinds of calls the model gets right. A strategy test also needs executable prices, fees, spread and position rules. The role of market liquidity helps explain why a paper forecast can be hard to trade at the quoted price.
Probability forecasts need calibration. If a model assigns 70% probability to many comparable events, roughly 70% should occur over a large sample if the estimates are calibrated. A probability can be calibrated without being useful, and useful without being perfectly calibrated, so compare it with a baseline and a scoring rule such as the Brier score, which measures the accuracy of stated probabilities.
Report a distribution, not only one average. Show median error and the large-loss tail alongside the average. Then break the results down by year, bull and bear periods, liquid and thin assets, and forecast horizon to reveal failure hidden by the total.
Data Leakage and Overfitting
Leakage occurs whenever training includes information unavailable at the forecast timestamp. Common forms include:
- scaling all observations before the train-test split
- using a revised economic series as if the revision were known earlier
- calculating a centered moving average with future points
- selecting features after seeing the final holdout
- using today's blockchain address label in an old prediction
- aligning daily series from different time zones without a cutoff rule
Overfitting is different. The data may be correctly timed, but the model adapts too closely to noise in the sample. Trying hundreds of feature sets, coins and settings raises the chance that one result looks good by accident.
NIST's AI Risk Management Framework emphasizes valid and reliable evaluation, uncertainty measurement and ongoing monitoring. Those ideas apply directly to market forecasts. A model should be rechecked during live use because its inputs, users and market context can change.
Why Crypto Forecast Models Fail
Market behavior is not stationary. Exchange access, derivatives, stablecoins, custody, regulation and participant mix change. When market structure changes, an old association may disappear or flip direction.
Prices also react to information that is absent from historical features. A software flaw, court ruling, exchange failure or unexpected policy decision cannot be inferred merely because the model has more layers. The broader crypto market context can explain a move after it happens, but it does not make that event predictable beforehand.
Thin assets create another problem. The last price may be based on a small trade, while a real order moves through several price levels. A model trained on last prices can look profitable before execution and fail after spread and price impact. Checking current exchange market access and a specific exchange's rules, such as Coinbase trading conditions, is part of evaluating whether a forecast can be acted on.
How to Evaluate a Public AI Forecast
Ask for a dated forecast record rather than a selected screenshot. The record should include every prediction, not only wins. Then check:
- What exactly was predicted?
- Which data were available at that timestamp?
- Was the test chronological and separate from model selection?
- Which simple baseline did it beat?
- Were costs and executable prices included?
- How did results change across market conditions?
- Is uncertainty shown as a range or probability?
- Does the provider disclose failed and expired models?
Do not let a percentage such as “90% accurate” stand alone. It could describe training data, one class in an imbalanced sample, a short period or a target too broad to be useful. A complete cryptocurrency assessment treats a forecast as one piece of evidence, not the conclusion.
Readers who choose to trade any forecast still need independent risk controls. Trading psychology and position discipline can keep confidence in a model from becoming an oversized position. Model accuracy does not set an appropriate risk amount.
Frequently Asked Questions
Can AI predict crypto prices accurately?
AI can produce forecasts that outperform a simple baseline in a defined test, but that does not mean it can predict prices reliably in every period. Accuracy depends on the target, data, chronological validation, costs and market conditions. Results should include uncertainty and performance after the model was fixed.
Which AI model is best for crypto prediction?
There is no universally best model. Linear models, trees and neural networks can each fit some datasets and fail on others. The appropriate choice depends on the target, sample size, data frequency and live constraints. Out-of-sample performance against a simple baseline matters more than the model label.
What is a good accuracy rate for a crypto model?
A rate is meaningful only beside the class balance, baseline, sample size and economic result. A 55% directional accuracy may add value in one setting and lose money in another after fees. Price-error and probability models also require different metrics, so one universal threshold would be misleading.
Can ChatGPT give reliable crypto price predictions?
No. ChatGPT and similar conversational models can summarize information or help design a research process, but they do not produce validated price forecasts without a defined model and test. A price answer is not reliable merely because it is specific. Ask for the data cutoff, target, test record, baseline and uncertainty. Without those elements, the number is an unsupported scenario rather than a validated forecast.
How often should a forecast model be retested?
Retest on a schedule that matches the forecast horizon and after material changes to data, exchange structure or model behavior. Monitoring should compare live errors with the original test distribution. A model should be paused when its inputs fail, drift exceeds set limits or results no longer clear the baseline.