


Quick Take
- Bitcoin’s October 7 readings showed fresh futures liquidations and a rolling price low below the morning quote.
- Positive October 6 ETF flows measured a completed fund session, offering no guaranteed protection against margin-driven futures closures.
- Matched positioning and directional spot data are needed to determine whether enough leverage has cleared to ease liquidation pressure.


Bitcoin’s October 7 morning market readings showed roughly $143 million in Bitcoin futures positions liquidated over the preceding 24 hours and a price range that dipped below $84,000. The positive US ETF session could not predict whether leveraged positions would survive their margin tests.
CoinGlass reported a BTC futures liquidation total of $143,016,790 at 06:53 UTC.
The 24-hour price range included a low of $83,647. CryptoSlate’s Bitcoin price page showed the price at around $84,288 during EU trading hours, down 1.25% over 24 hours.
US spot Bitcoin ETFs recorded $118.8 million in net inflows for October 6, according to Farside Investors after a net outflow for October 5.
Why positive fund flows are no price floor
Liquidation responds to the trader’s margin position as prices change. Bybit’s liquidation rules use mark price, the exchange’s reference price for margin calculations, rather than the last trade. The trigger varies by margin mode.
Nor does a daily ETF inflow represent a standing bid at a guaranteed Bitcoin price. BlackRock’s iShares Bitcoin Trust ETF, or IBIT, uses authorized participants creating or redeeming baskets for cash or Bitcoin in its prospectus. While the fund seeks to track Bitcoin’s price, the flow figure alone cannot show when or where an equivalent spot purchase occurred.
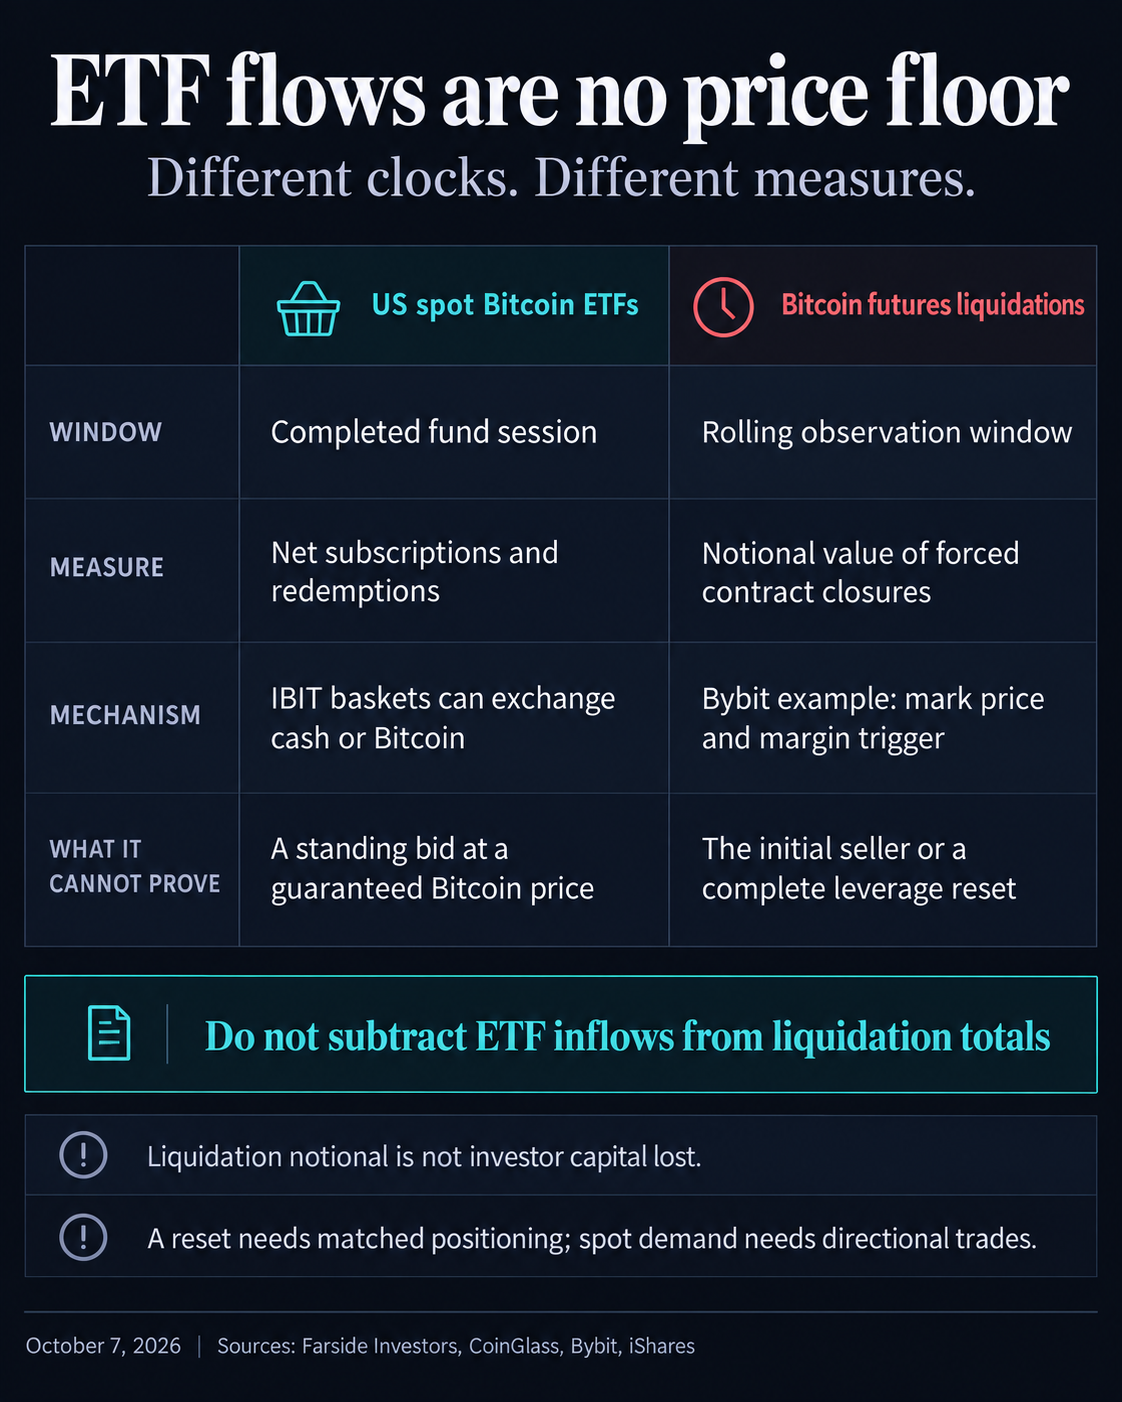
Subtracting ETF inflows from liquidation notional would therefore reveal no net buying or selling balance. Fund demand and forced closures can coexist without establishing that derivatives selling overwhelmed ETF buying.
For traders, the remaining question is whether enough leverage has cleared to ease further liquidation pressure. The fresh total confirms forced closures, but CoinGlass’s single open-interest reading, a measure of outstanding futures exposure, provides no comparable before-and-after view.
Gross spot volume leaves a similar gap: turnover alone does not show whether net buying weakened. The next useful signals are changes in outstanding positions and directional spot trading measured on the same venues over the same interval. Those would help distinguish cleared leverage from persistent selling pressure.

Bitcoin is -3.18% over the past 24 hours and currently sits at rank #1 by market cap.
Mentioned in this article


Editorial credits