Research: NFTs accounted for 28% of the ETH gas usage in January
The Defi, ERC20, and stablecoins categories occupy the second, third, and fourth largest share with 8%, 8%, and 6%, respectively.
Cover art/illustration via CryptoSlate. Image includes combined content which may include the use of AI tools.
CryptoSlate analysts examined the gas usage shares of different transaction categories on the Ethereum (ETH) network and found that the NFTs category accounted for 28% in the first month of the year.
The analysis divides all transactions on the ETH network into eight categories as Vanilla, ERC20, Stablecoins, DeFi, Bridges, NFTs, MEV Bots, and others.
The second, third, and fourth categories that occupied the most significant gas usage by share appeared as Defi, ERC20, and stablecoins, with 8% for Defi and ERC20 and 6% for stablecoins.
The categories
The vanilla category includes pure ETH transfers between Externally Owned Accounts (EOAs) issued without calling any contracts. The ERC20 class counts all transactions that call ERC20 contracts, excluding stablecoin transactions.
The stablecoins category represents all fungible tokens that have their value pegged to an off-chain asset either by the issuer or by an algorithm. This category includes over 150 stablecoins, with Tether (USDT), USD Coin (USDC), Binance USD (BUSD), and DAI (DAI) being the most prominent ones.
The Defi category covers all on-chain financial instruments and protocols implemented as smart contracts. Decentralized exchanges (DEXs) also fall under this category. More than 90 Defi protocols are represented under this section, including Uniswap (UNI), Etherdelta, 1 inch (1INCH), Sushiswap (SUSHI), and Aave (AAVE).
Bridges represent all contracts that allow the transfer of tokens between different blockchains and includes over 50 bridges such as Ronin, Polygon (MATIC), Optimism (OP), and Arbitrum (ARBI).
All transactions interacting with non-fungible tokens fall under the NFTs category. This section includes both ERC721 and ERC1155 token contract standards and NFT marketplaces for trading them.
MEV bots, or Miner Extractable Value bots, represent bots that automatically execute transactions for profit by reordering, inserting, and censoring transactions within blocks.
All remaining ETH transactions are gathered under the Other category.
Gas usage by category
The chart below represents the relative amount of gas consumed by each category in the ETH network. The chat starts from January 2020 and represents the gas usage share of each category with a different color.
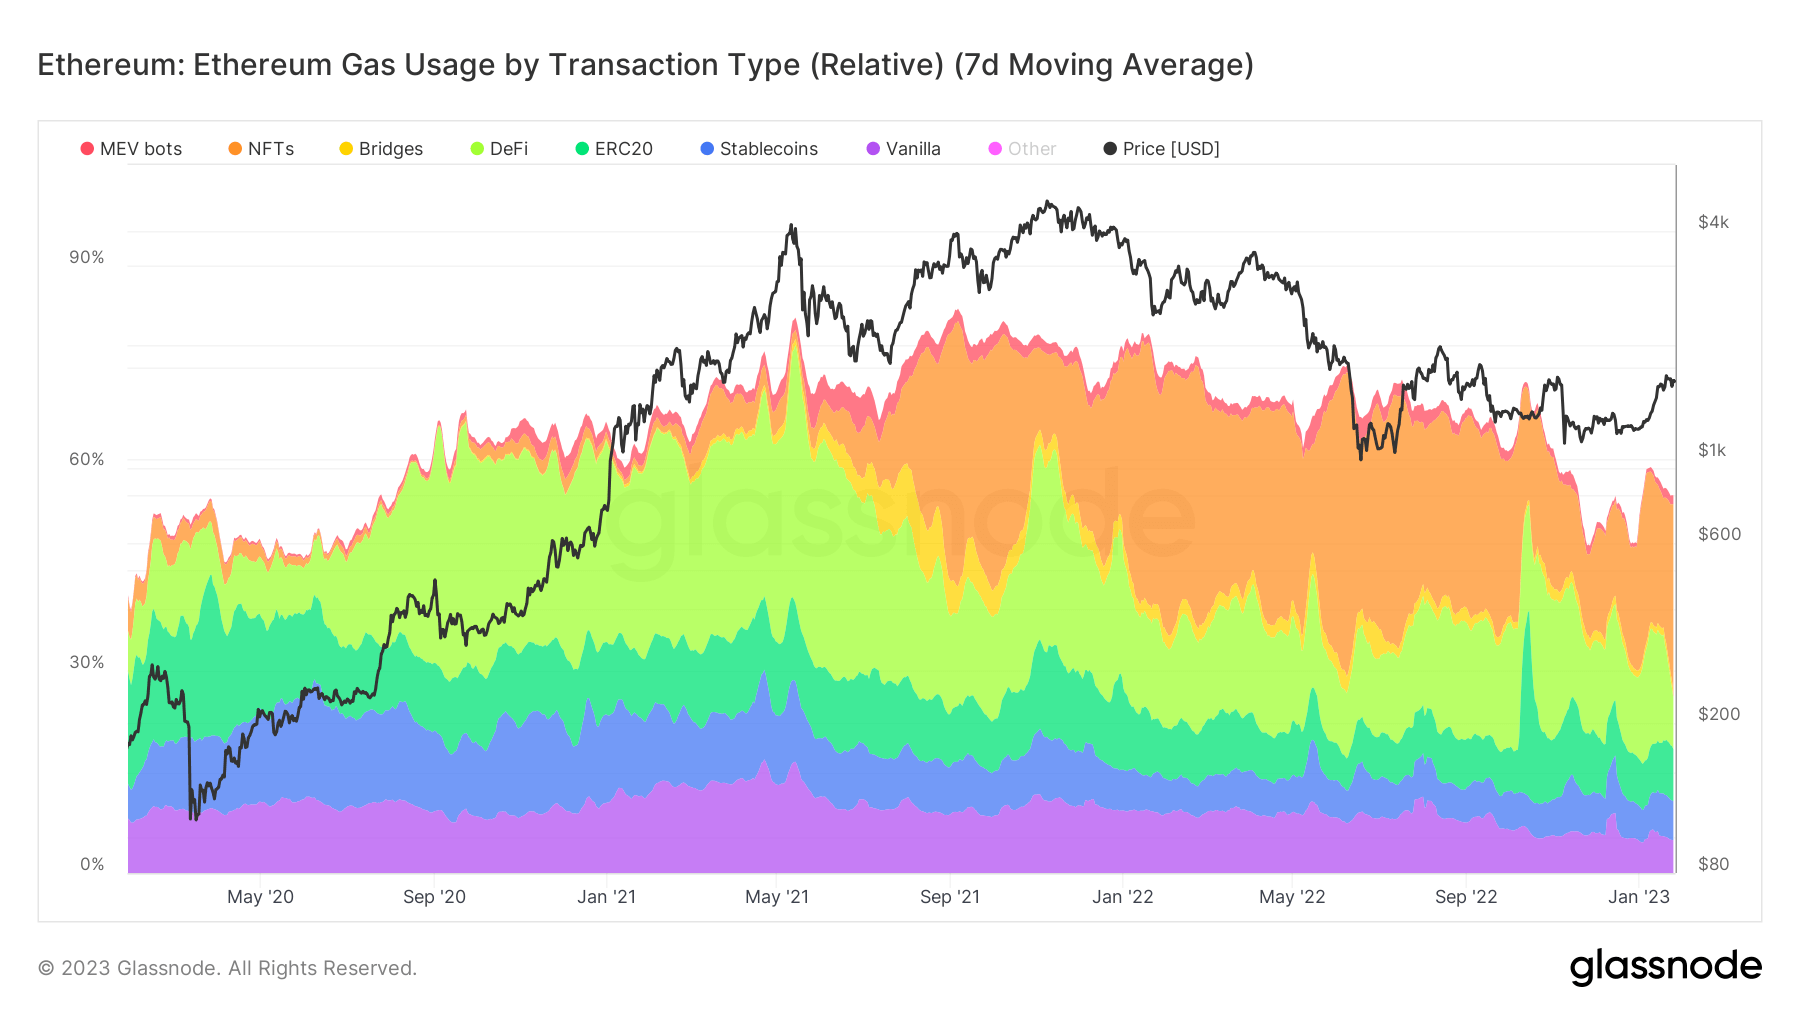 At first glance, the NFTs, Defi, ERC20, Stablecoins, and Vanilla categories stand out as they have the most visible shares in total gas fees.
According to the data, the NFTs category currently accounts for 28% of the total gas fees on the ETH network, which is represented with the orange zone. This category's share was only around 4% in early May before the pandemic started.
The Defi takes up the second largest share with 8%, represented by the light green area. Both the NFTs and the Defi category recorded an increase in gas fee shares since the pandemic started. The ERC20 category accounts for 8% of the total gas share. Represented by the dark green area, the category's share halved from 16% in October 2022.
In the meantime, stablecoins' percentage remained flat, around 5-6%, as can be seen from the dark blue zone as well. Finally, the vanilla category continued to account for around 5% of total gas fees.
Gas usage by NFTs
Looking at the gas usage of the NFTs category in detail, OpenSea appears as dominant. The chart below represents the NFT marketplaces' share in gas usage since the beginning of 2018.
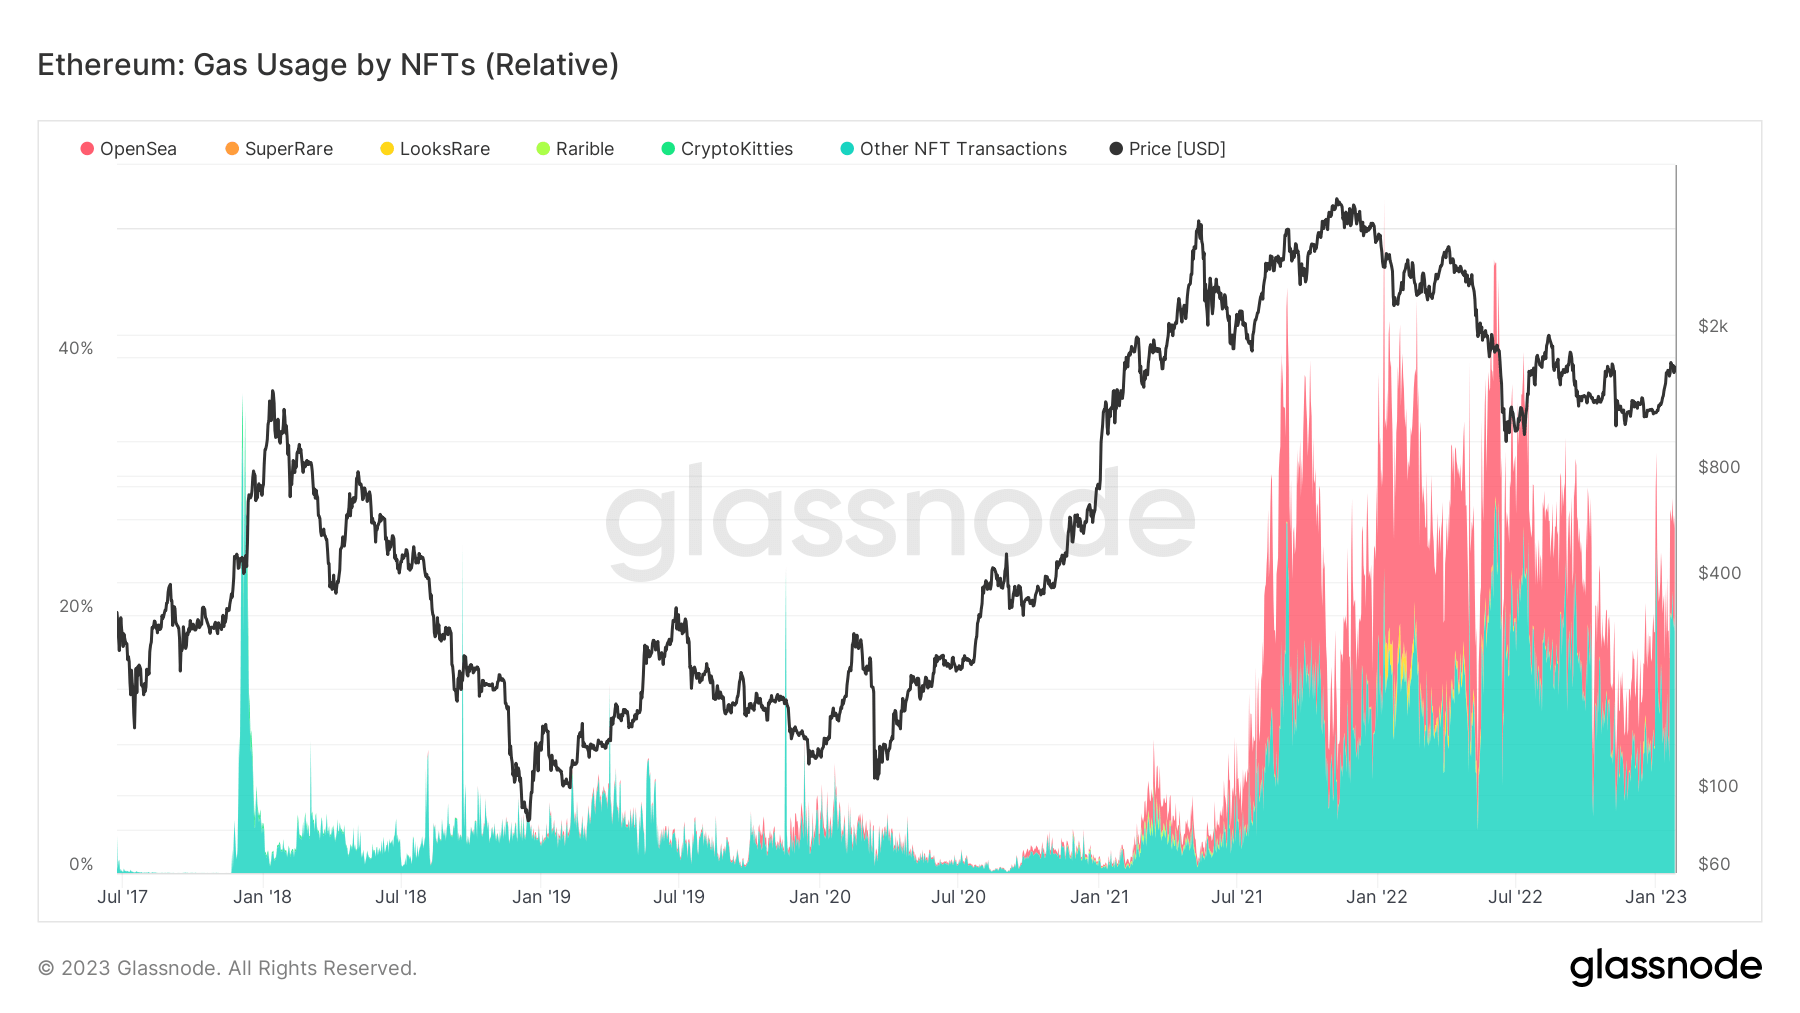
OpenSea appeared in early 2020 and significantly increased its share in gas usage after mid-2021. It remains the dominant NFT marketplace that occupies enough gas usage to leave a mark on the overall chart, except for a short period in January 2022, where LooksRare accounted for enough gas usage to appear briefly next to OpenSea.
Gas usage by stablecoins
The breakdown of the gas usage share of stablecoins also emphasizes USDT's dominance. The chart below represents major stablecoins' gas usage shares from the beginning of 2018.
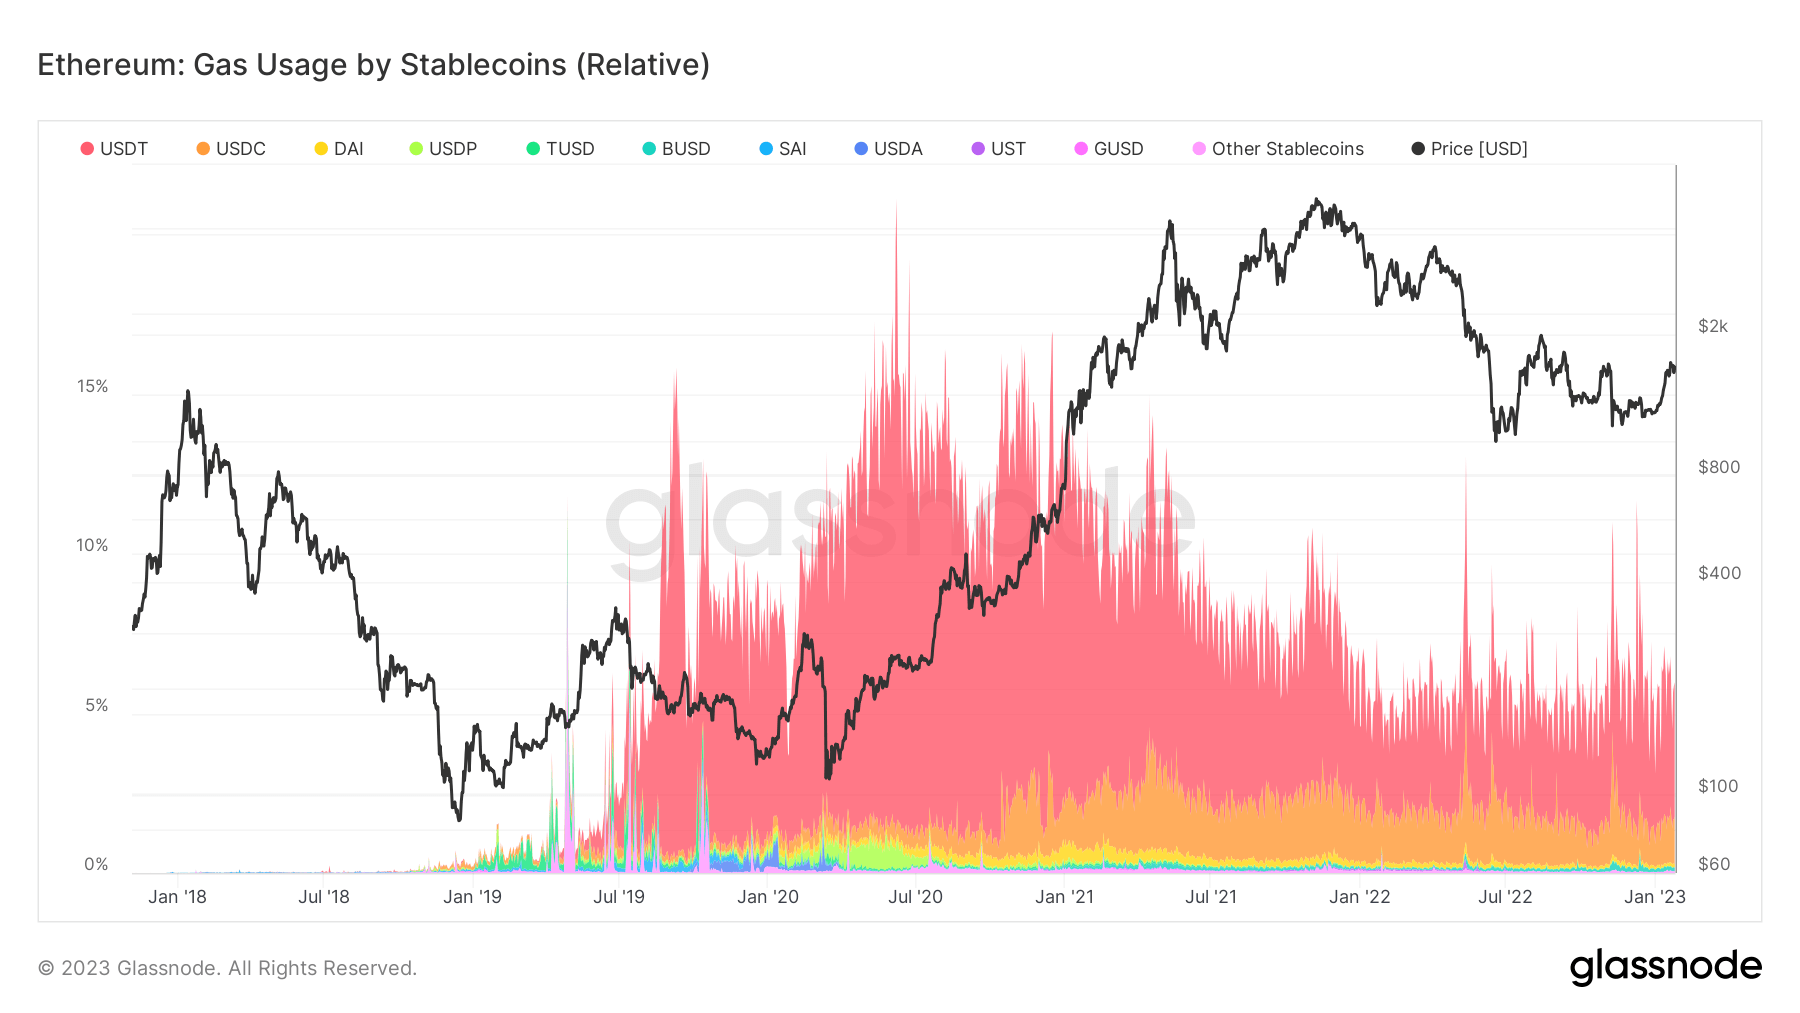
Even though USDT remains the dominant stablecoin, its share still recorded a significant decrease from 11% to 4%. On the other hand, USDC became visible on the chart in early 2020 and has been growing its share in gas usage slowly but steadily since then.