
Quick Take
- No tested price, leverage or order-flow metric warned consistently before all seven liquidation cascades.
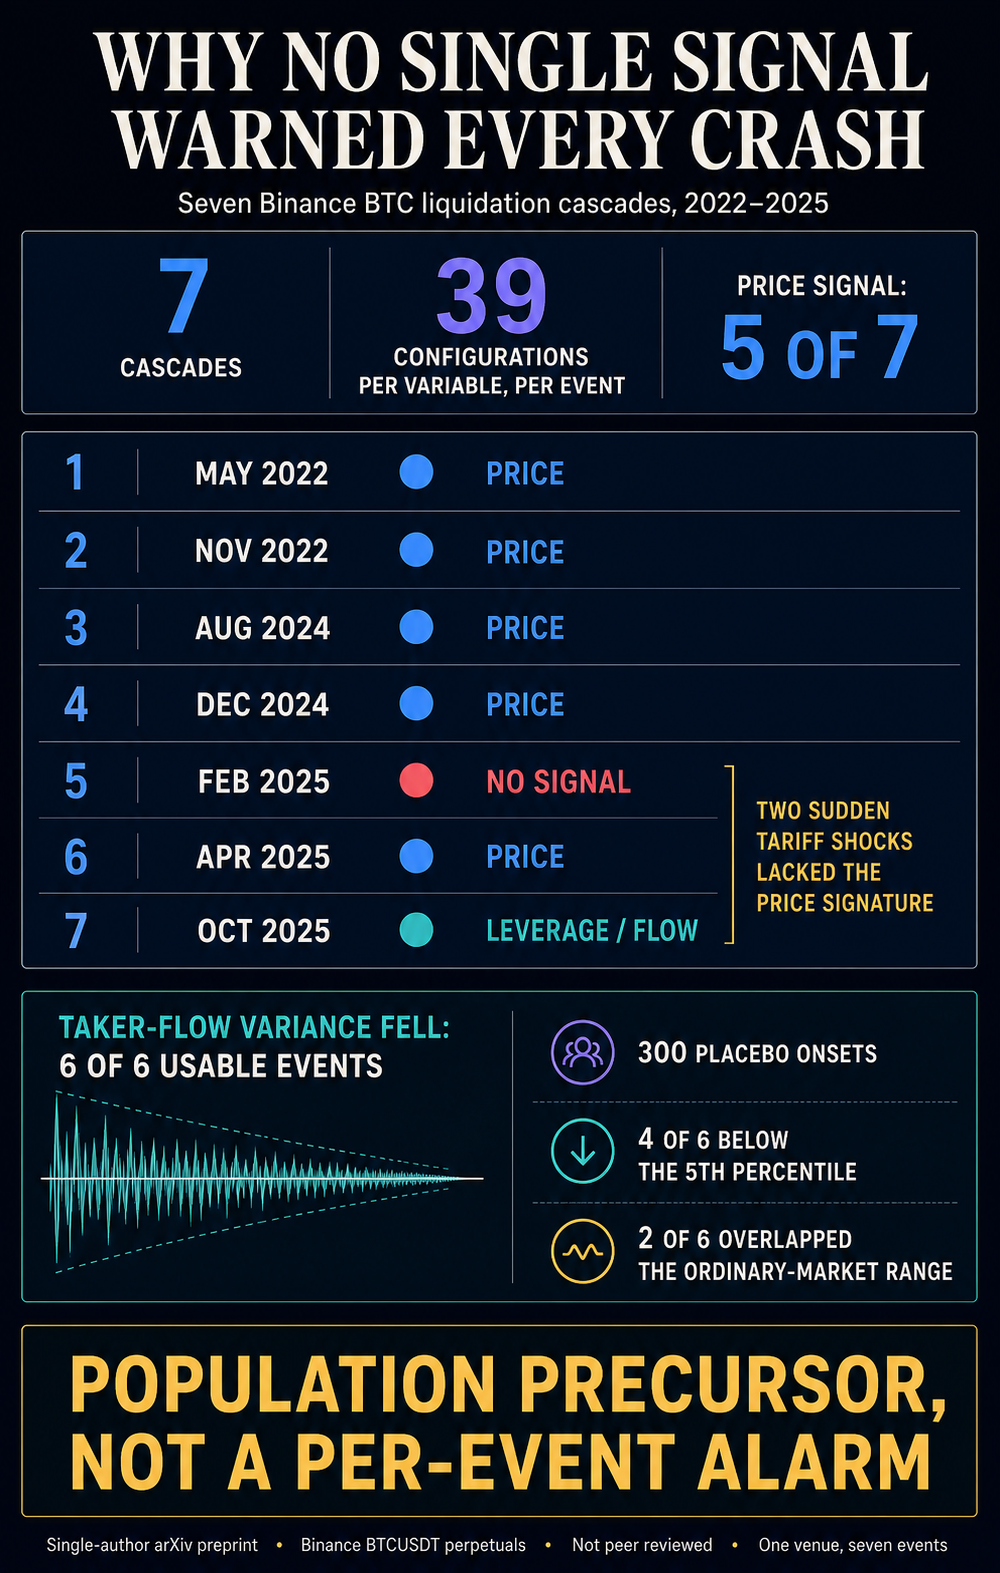
- Price showed a slowing-down signal in five events, but not in the two sudden tariff shocks.
- Taker-flow variance fell before six cascades, yet the pattern was too weak to predict an individual crash.


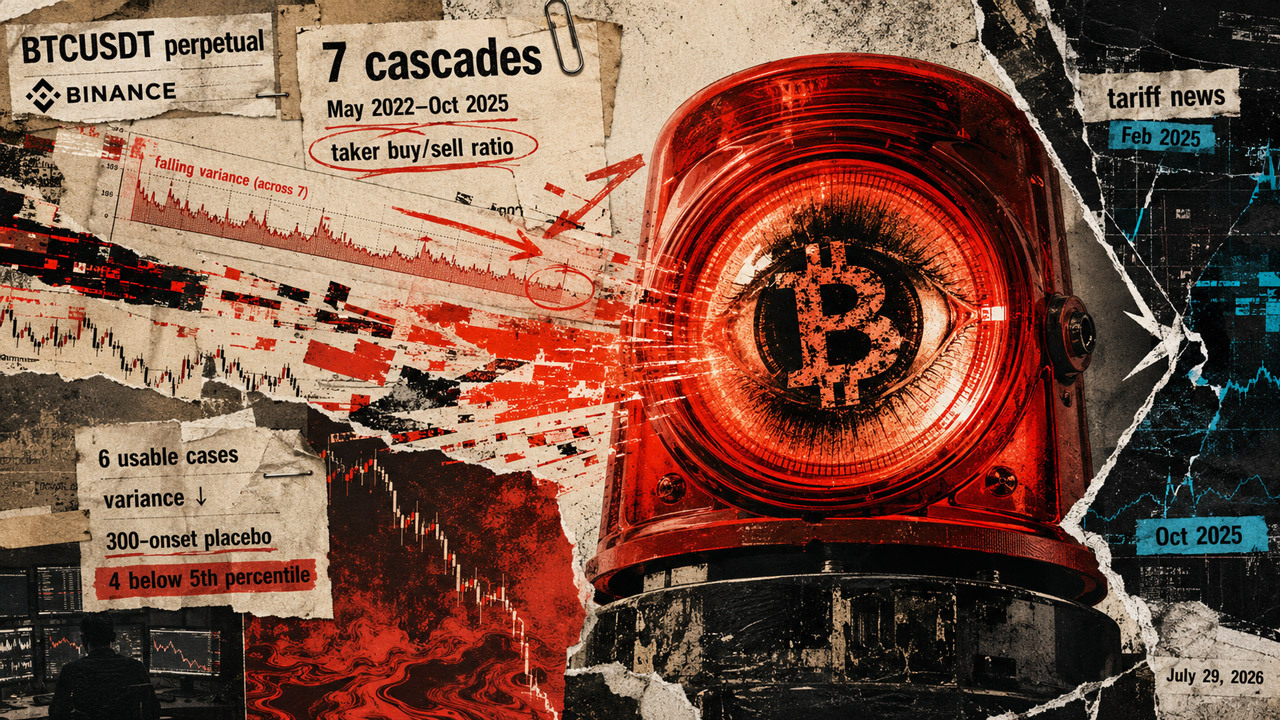
A new arXiv preprint studying seven major Bitcoin crashes found the warning signal shifting among price, leverage, and order flow from one event to the next.
One clue echoed across six usable cases. Taker order-flow variance tightened before each cascade, a faint weather front across the group rather than a siren traders could trust to call the next crash.
Ramon Marc Garcia Seuma submitted the single-author paper on July 29, 2026. The work has not been peer reviewed. It analyzed Binance's USD-margined BTCUSDT perpetual market across cascades from May 2022 through October 2025, using one-minute price bars and five-minute open interest, trader positioning, and taker buy/sell data over roughly two-month event windows.
The signal moved with the trigger
In the study's framework, a market nearing a critical transition should recover more slowly from disturbances, leaving price or market structure with more statistical memory. The author tested rolling variance and lag-1 autocorrelation on detrended residuals across 39 combinations of analysis windows for every variable and event.
Price carried that signature in five of the seven cascades, but not in the February and October 2025 events tied to sudden tariff news. The paper proposes a possible split: cascades that build as markets absorb stress may leave a price signal, while abrupt external shocks may not. With only two events in the sudden-shock group, however, the author describes that pattern as a hypothesis to test, not a validated taxonomy.
The strongest warning against generalizing came from the paper's out-of-sample test. October 2025 appeared to show the signal in leverage and order flow rather than price. When the same analysis was applied to the August 2024 cascade, the pattern inverted: price carried the signal while most leverage and flow variables did not. No tested variable carried the same positive critical-slowing-down signature across all seven events.
One inverse order-flow pattern did recur, but it did not solve the per-crash warning problem. Falling variance in the taker buy/sell ratio appeared before every cascade with usable data, covering six events.
All six observations fell in the left tail of a 300-onset placebo distribution, and four were below its fifth percentile. Yet two events overlapped the ordinary-market range individually, so the paper classifies the compression as a population-level precursor rather than a reliable alarm for a specific crash.
The sample covers seven events on one exchange, some 2022 series are incomplete, and the public leverage and flow measures are proxies because direct intraday liquidation snapshots were unavailable. Other public gauges previously discussed by CryptoSlate, including basis, ETF flows and collateral settings, were not tested as early-warning candidates.
A later liquidation event shows how much remains outside the evidence. CryptoSlate reported roughly $1 billion in forced derivatives closures during a June 25, 2026 Bitcoin selloff, after the study's sample ended.

Bitcoin is +1.13% over the past 24 hours and currently sits at rank #1 by market cap.
Mentioned in this article

Editorial credits