


Quick Take
- A roughly 2.2% decline from Bitcoin’s Sept. 29 quote near $83,579 would reach Seyffart’s $81,722 ETF cost estimate.
- ADP arrives 15 minutes before PCE and GDP on Sept. 30, making Treasury yields a useful check on Bitcoin’s first reaction.
- Glassnode’s dated $84,000-$85,000 holder supply zone stands overhead, while Adler’s $80,500 annual moving average sits below the ETF estimate.


Bitcoin registered an intraday low of $82,775.94 on Sept. 29 before rebounding above $83,000, close to a price that could change the estimated profitability of the average Bitcoin ETF holder when Wednesday’s US inflation data arrive.
A decline of about 2.2% from mid-$83,000 would reach $81,722, a target that Bloomberg ETF analyst James Seyffart estimated on Sept. 21 as the average ETF holder’s cost basis, saying the recent rally had put that holder back in profit.
Individual investors have different purchase prices, and a move through $81,722 would make their trading decisions worth watching. A Sept. 9 Glassnode report placed a differently measured ETF-complex break-even near $86,000.
Seyffart’s later estimate gives Wednesday’s price action a specific threshold, with its scope and date attached.
Levels around the ETF estimate
The immediate reference above Tuesday’s captured price is an $84,000-$85,000 zone, as Glassnode’s Sept. 23 report called it the largest cluster of long-term-holder supply. Bitcoin traded above that zone when the report was published, while Tuesday’s quoted price was below it.
Analyst Axel Adler Jr. calculated Bitcoin’s 365-day moving average at $80,500 on Sept. 22, so a fall through $81,722 followed by a test of $80,500 would carry price below two separate reference points.
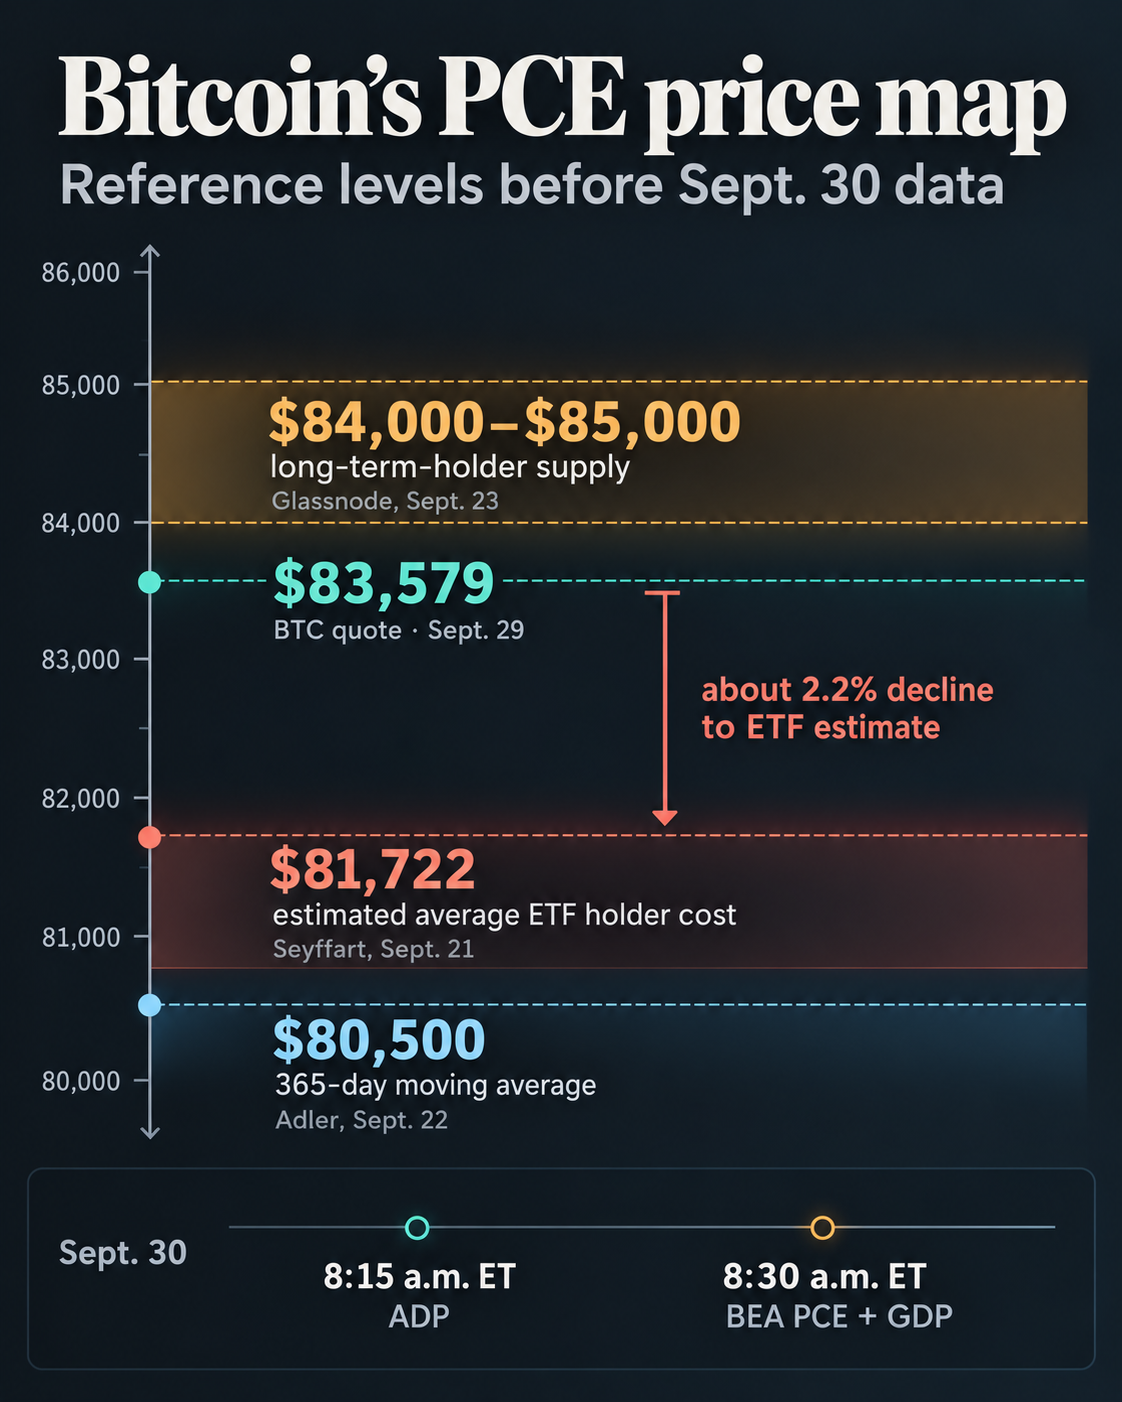
ADP schedules its September private employment report for 8:15 a.m. ET; the Bureau of Economic Analysis is due to release August personal income and outlays at 8:30 a.m. ET, and BEA also schedules the third estimate of second-quarter GDP for that time.
Those releases coincide with BEA’s annual update of national and regional economic accounts, which includes revisions to historical series. Traders may reassess their initial reaction to the new inflation figures as they absorb the employment data, GDP estimate, and revisions.
Because ADP comes first, yields may already be moving before the PCE figure lands. The 8:30 a.m. window then combines new inflation data with GDP and a revised historical baseline.
A Bitcoin move during those minutes could reflect more than one release. Following yields through the session and checking where Bitcoin trades after the initial swings would give the price reaction a clearer macro context.
If a hotter PCE reading lifts yields and Bitcoin trades below $81,722, the average position under Seyffart’s estimate would be back in loss territory. The next evidence would come from whether price remains below that level after the first burst of volatility and what subsequent ETF flows and spot buying show.
If a softer reading pulls yields lower, Bitcoin could instead test Glassnode’s $84,000-$85,000 zone. A sustained move through it would say more about demand than a brief spike. A reading close to expectations may give ADP, GDP, and the revisions more influence, keeping Bitcoin between the nearby levels despite sharp intraday moves.
The $81,722 figure is close enough to the Sept. 29 intraday low to be tested by a modest move, but the lasting signal is whether yields confirm the direction and price holds on one side of the estimated ETF-holder basis after the data window clears.

Bitcoin is -0.99% over the past 24 hours and currently sits at rank #1 by market cap.
Mentioned in this article


Editorial credits