


Overview
Introduction
On-chain data starts with what a network records. A Bitcoin block contains confirmed transactions and the outputs they create. Whether an output remains unspent is a property of the current ledger state, not of the block. Ethereum blocks contain transactions that update account balances and contract state. A block explorer exposes parts of that record in a readable form.
Metrics such as active addresses, exchange inflows or realized capitalization are not raw facts in the same sense as one transaction hash. They depend on definitions, address clustering, entity labels, price sources and chain-specific calculations. Good analysis keeps those layers separate.
Key takeaways
Raw, Labeled, and Derived On-Chain Data
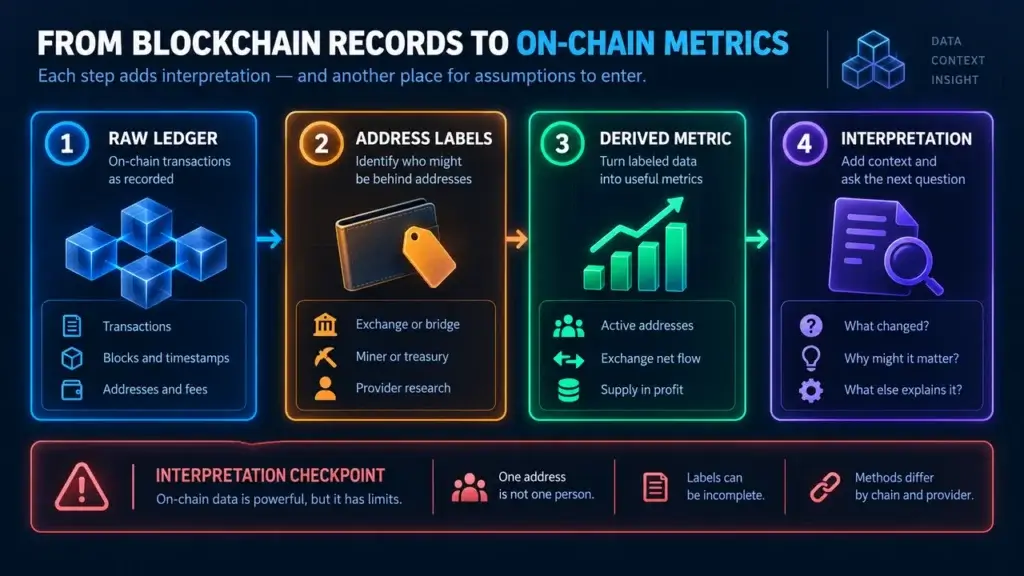
Three data layers lead to a fourth interpretation step that asks what changed, why it may matter and what else could explain it.
Raw ledger observations include transaction identifiers, block numbers, timestamps, sending and receiving addresses, transferred values, fees and contract events. Bitcoin's developer documentation describes its blockchain as an ordered, timestamped public transaction ledger. Ethereum's block documentation explains how ordered transactions update global state.
Labeled data attaches an identity or category to an address. A provider may label a wallet as an exchange, bridge, fund, miner or protocol treasury. The underlying address is public, but the label can come from public disclosures, transaction patterns or provider research.
Derived metrics combine observations through a formula. Daily active addresses, realized value, supply in profit—the units whose last movement was at a price below the current one—and exchange net flow are examples. The formula can be transparent while assumptions about labels or chain behavior remain uncertain.
CryptoSlate's block explorer definition explains the common interface. The distributed ledger concept provides the broader data model.
UTXO and Account-Based Chains
Bitcoin uses unspent transaction outputs, or UTXOs. A transaction consumes earlier outputs and creates new ones. A wallet may control many addresses and outputs. “Coins moved” can include change returned to the sender, so the visible transferred value may overstate the economic payment.
Ethereum uses an account-based system. Accounts carry balances and a nonce that counts transactions from the account, while smart contracts store code and state. One transaction can trigger many token transfers and internal calls. A metric that counts only top-level transactions can miss contract activity, while a metric that counts every event can count one user action many times.
This difference affects cross-chain comparisons. Address activity, transfer count, fees and realized-value calculations need a method suited to the chain. Coin Metrics' realized capitalization methodology explicitly uses different last-activity logic for UTXO and account-based assets.
The Ethereum account model is the primary reference for that structure. CryptoSlate's Bitcoin asset record and Ethereum network data supply current market context.
Network Activity Metrics
Activity metrics try to summarize how much the network is being used. Common fields include:
- transaction count
- active sending or receiving addresses
- transfer value
- block space used
- fees paid
- smart-contract calls
- new addresses
Each needs a definition. “Active address” may mean any address that sent or received during the period. An exchange can move funds among its own wallets and create activity without a new user. One person can use many addresses. A contract can serve many people through one address.
Fees can indicate competition for block space, but higher fees are not unambiguously positive. They may reflect genuine demand, congestion, a short-lived token launch, spam or an unusual event. Compare several periods and check which applications generated the activity.
Supply and Holder Metrics
Blockchains can show where native assets or tokens sit, but ownership interpretation is difficult. Common measures include supply held by long-inactive addresses, balances by cohort, concentration among top addresses, staked supply and newly issued units.
A top-address table can be misleading because one exchange address may custody funds for many customers. A bridge contract may lock assets that correspond to representations on another chain. A burn address may hold units that no one can spend. Entity-adjusted analysis tries to cluster related addresses, but clustering methods can create both missed links and false links.
The meaning of a wallet address is narrower than user identity. For market-cap work, circulating supply methodology also matters because providers can classify treasury, locked and bridged units differently.
Exchange Flow Metrics
Exchange inflow usually estimates how much crypto moved into addresses labeled as centralized exchanges. Outflow estimates movement away from those addresses. Net flow subtracts outflow from inflow for a period.
The common interpretation is that inflows may increase supply available for sale, while outflows may reflect custody or longer-term holding. That is only a hypothesis. An inflow can support collateral, settlement, market making or an internal exchange move. An outflow can go to another exchange, a lending platform or a custodian rather than long-term storage.
Label coverage changes over time. A new deposit address may be missed until it is identified. Exchanges can reorganize wallets. Transfers between exchanges can count as one outflow and another inflow without changing aggregate investor intent.
Use available centralized exchanges to understand market structure and a specific profile such as Coinbase exchange research for custody and access context. An on-chain label is not a substitute for confirmed exchange policy.
Realized Value and Cost-Basis Metrics
Traditional market cap applies the current price to circulating supply. Under the provider's method, realized capitalization assigns different units a value based on the market price when they last moved. Analysts use it to estimate an aggregate on-chain cost basis.
The metric is useful because old units are not valued at today's price. It is limited because movement does not always mean a change of beneficial owner. A person can transfer between personal wallets. An exchange can reorganize custody. Account-based assets require assumptions about when an account's balance was last active.
Derived measures such as market-value-to-realized-value ratios inherit those assumptions. They should not be treated as natural laws or fixed buy and sell thresholds. The market cap and supply relationship provides the valuation base, while the realized version adds another estimation layer.
A Large Transfer Worked Example
Suppose a tracker reports that 50,000 units moved from a wallet labeled “unknown” to an exchange. The transaction is real, but at least four explanations remain:
- A holder intends to sell.
- A custodian is moving client funds into exchange storage.
- The exchange changed an address that the data provider has not labeled yet.
- The funds are being posted as collateral or moved for settlement.
Before interpreting the transfer, check the transaction path, prior behavior of both addresses, related transactions, exchange labels from more than one source and whether aggregate trading data is consistent with a sale of that size. Public trading data cannot attribute a fill to a specific depositor. If price does not move, that does not prove no sale occurred. If price falls, that does not prove this transfer caused it.
The same discipline applies to a whale alert. State the observation first: “50,000 units moved from address A to labeled address B at time T.” Then list plausible explanations and the evidence that would distinguish them. Avoid turning a label into a motive.
How to Read Stablecoin and Bridge Data
Stablecoin supply can expand when tokens are issued and contract when they are redeemed or burned, but the economic meaning depends on the issuer and reserve system. A transfer between chains may lock tokens in a bridge and mint a representation elsewhere. Counting both sides without adjustment can double-count apparent activity or supply.
Check the canonical issuer, contract address, chain, mint and burn events, bridge accounting and reserve disclosures. A stablecoin balance on an exchange can support trading without revealing whether the holder intends to buy or sell. Keep token and chain identity explicit before comparing supply across networks.
Wallet choice also affects what a reader can verify. Crypto wallet comparisons cover custody and access, while on-chain metrics describe the public record after transactions occur.
Limits of On-Chain Analysis
Public does not mean complete. Centralized exchange trades occur inside internal ledgers until deposits or withdrawals touch the blockchain. Off-chain orders, derivatives, identity, intent and many legal relationships are absent.
Privacy tools, address rotation, rollups and cross-chain bridges can make attribution harder. A base chain may record a compressed proof or batch instead of every end-user action in directly readable form.
Provider methods also change. An improved label set can revise historical exchange flows even though the blockchain record did not change. A metric report should name the provider, version or access date when reproducibility matters.
Finally, activity is not the same as economic value. A network can process many low-value or automated transactions. A small number of high-value settlements can be economically important. Analysis needs project purpose, users, costs and an explanation of how the token accrues value alongside raw counts.
An On-Chain Analysis Workflow
- Define the question before opening a dashboard.
- Identify the chain, asset, contract and time window.
- Separate raw observations from labels and formulas.
- Read the metric definition and chain-specific method.
- Compare at least two related measures rather than one line.
- Check alternative explanations for any large change.
- Compare with price, liquidity and known events without assuming causation.
- Save the source, timestamp and definition used.
Use CryptoSlate's tracked crypto assets for live market data and current analytical coverage for time-sensitive context.
A full cryptocurrency research memo combines on-chain evidence with project, supply, governance, security and market structure.
When on-chain activity coincides with a rapid move, crypto volatility drivers help trace liquidity, margin and information effects without assigning causation to one metric.
Frequently Asked Questions
Is on-chain data public?
Data recorded on a public blockchain is generally inspectable, but identity and intent are not automatically public. Addresses are pseudonymous, centralized exchanges keep internal records off-chain and some systems batch or obscure user-level activity. Providers add labels and derived metrics that require separate evaluation.
Does one wallet address equal one user?
No. One person can control many addresses, and one exchange or custodian address can represent many people. Smart contracts and bridges can also hold assets for large user groups. Address counts should be described as address activity unless a documented entity-adjustment method is used.
Are exchange inflows always bearish?
No. An inflow can precede a sale, but it can also reflect custody reorganization, collateral, settlement or an exchange transfer. Check address history, related flows and market context. Aggregate trading data can be consistent with a sale, but it cannot tie a fill to a specific depositor. The transaction is observable, while the owner’s purpose usually is not.
Which on-chain metrics are most useful?
The useful metric depends on the question. Fees and active addresses can help assess activity, supply cohorts can describe holding behavior and exchange flows can show movements into labeled exchanges. No single metric captures network health or future price. Use definitions and related measures together.
Can on-chain data predict crypto prices?
It can provide features that correlate with later returns in some samples, but correlation may change and causation is rarely simple. A price forecast still needs out-of-sample testing on later data, a baseline to beat, trading costs and a stated error range. On-chain evidence is better treated as one input to a wider analysis.