Top 3 altcoins: Ethereum, XRP, and Litecoin technical analysis

Cover art/illustration via CryptoSlate. Image includes combined content which may include the use of AI tools.
The top three altcoins seem to have entered a bull market as more investors show signs of fear-of-missing-out. This technical analysis will determine whether Ethereum, XRP, and Litecoin are poised to continue surging following the massive rally that they all have experienced since mid-December 2018.
Ethereum
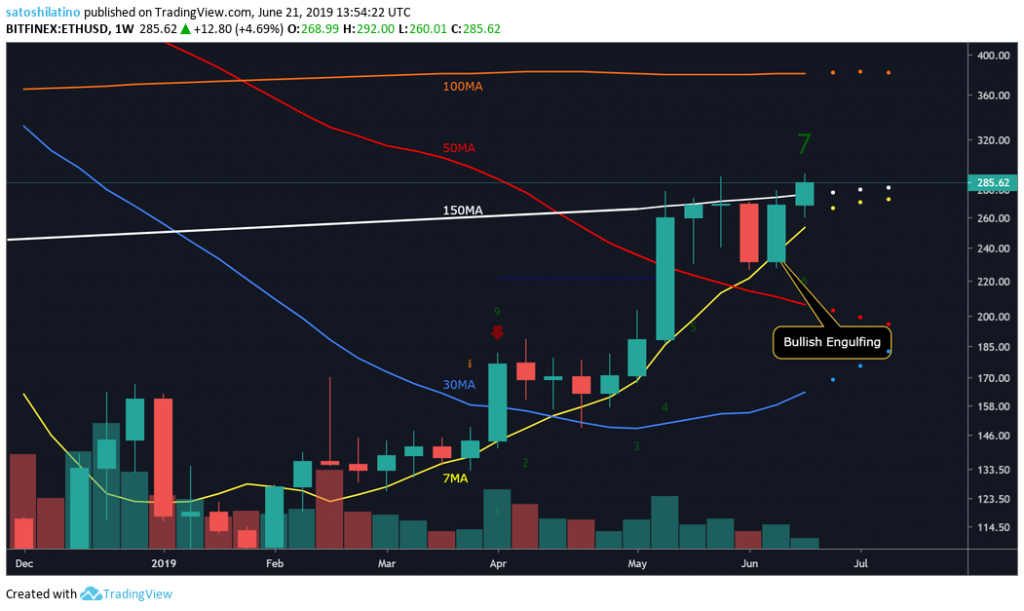
A bullish engulfing pattern has formed on Ethereum’s 1-week chart since one of the most recent candlesticks is completely overtaking the body of the previous one. This is considered a reversal formation indicating that ETH could go up higher.
It is worth noting that the greater the number of red candlesticks preceding the engulfing candle, the higher the chances for a bullish reversal, but a rising volume will play a key role in validating the pattern.
In addition, for the bull trend to continue Ethereum will have to break above the 150-week moving average, which has been acting as a strong point of resistance for the last 5 weeks. After being tested for so long, the 150-week MA could be losing its strength, increasing the probability of a breakout that could take ETH to test the 100-week MA that is sitting around $400.
On the 3-day chart, a bull flag appears to be developing. This is a continuation pattern that formed after the upswing that took Ethereum from $170 to $279, known as the flagpole, and was followed by the current consolidation period between $279 and $233, which is forming the flag and could lead to a breakout in the same direction as the initial movement.
This bullish formation predicts a 40 percent surge that is given by measuring the height of the flagpole and adding it to possible breakout point at $279.
The bull flag will be invalidated if Ethereum moves below the lowest point of the flag at $233.

The Bollinger Bands on the 1-day chart seem to be coming closer together, compressing the middle band or 20-day moving average. This process is called a squeeze, which indicates that after the current period of low volatility another period of high volatility will follow.
Although the bands do not give a clear indication when the breakout may occur or which direction the price could move, based on the larger timeframes, evidence suggests it will go.
XRP
XRP appears to be trying to break above the $0.46 resistance level on the 1-day chart after bouncing off the $0.38 support.
As a rule of thumb, support and resistance levels are based on historical data that help identify the price points that act as barriers in bearish or bullish moves, pausing the continuation of a trend due to unusually high supply or demand.
Therefore, if XRP is able to break above resistance it could rise higher to try and reach the next hurdle point at $0.54. Failing to move above $0.46 could trigger a pullback to $0.38 or even $0.30.
On the 3-day chart, XRP is trading above the 7-three-day moving average. Continuing to trade above the 7-three-day MA will be a good sign for prolonging the bullish trend, but breaking below it could take XRP to test the support given by the 30 or even the 50-three-day moving average.
A bull pennant appears to be forming on the 1-day chart. This is a continuation pattern, similar to a bull flag, that was created after the 60 percent move that XRP went through, known as the flagpole, and was followed by the current consolidation period that is building the pennant and could lead to a bullish breakout.
This technical formation predicts a 30 percent upswing upon the break of the pennant but could be invalidated if XRP moves below $0.41.
Litecoin
Litecoin is trading between a series of support and resistance levels that have acted as hurdles during its price movements due to the concentration of buy and sell orders on the 1-week chart.
If LTC is able to move above the $145 resistance level, it will most likely try to test the next one at $184.5.
Conversely, if it trades below the $115 support level, a drop down to the next level demand at $93.5 could be expected.

Litecoin can be seen trading inside an ascending parallel channel since mid-December 2018 on the 3-day chart. Its price action has basically been contained between two upward sloping parallel lines allowing LTC’s price to make higher highs and higher lows as it moves.
Based on the TD Sequential Indicator, Litecoin is on a green nine, which is a sell signal. Since it is trading around the middle of the channel, the bearish signal could take it down to the bottom of the channel.
A breakdown below the ascending parallel channel could indicate a possible trend change from bullish to bearish.
Although the market valuation of Litecoin may appear to be random, it actually creates repeating patterns and trends.
Prior to the 2015 halving event, Litecoin was going through a consolidation period that lasted almost a month, where it was trading between $1.35 and $1.50. On May 22 of that year, LTC’s price broke out and within a month and a half it reached $8.97, which represented a 590 percent upward move.
By July 9, LTC had reached its peak and began a 73.2 percent decline to reach the 200-day moving average at $2.40 just one day before the halving occurred.
Based on what happened in 2015, it can be assumed that something similar could happen this year as the halving approaches.
Since the low of Dec. 7, 2018, when LTC was trading at $22.54, it has gone up 539 percent to reach a high of $144 on June 12, 2019. Now, that the block rewards reduction is just 46 days away from, Litecoin seems to have topped.
If history repeats itself, LTC could soon pullback to the 200-day moving average just as it did in 2015, which will represent a 55 percent correction, dragging its price down from the recent high of $144 all the way to around $65.

Overall Sentiment
The cryptocurrency market has entered a bull run and even though it has seen some minor pullbacks it continues to make higher highs. At the moment, Ethereum and XRP look like they could be about to breakout while Litecoin could soon face a correction, but it could still have some legs up.
Determining the direction of the price action that the cryptocurrencies previously analyzed will take depends upon the confirmation of a break of the resistance or support points mentioned before.