These three cryptocurrencies could serve as a hedge against Bitcoin

Cover art/illustration via CryptoSlate. Image includes combined content which may include the use of AI tools.
The cryptocurrency market tends to move in one direction, which is mostly defined by Bitcoin’s price action. However, a recent report shows that several cryptos have proved to be highly uncorrelated. This feature makes them ideal to use as a hedge against the rest of the market.
The most uncorrelated assets
Investopedia defines the term correlation as a statistic that measures the degree to which two assets move in relation to each other. This gauge can be implemented in portfolio management and is computed as a value that must fall between -1.0 and +1.0.
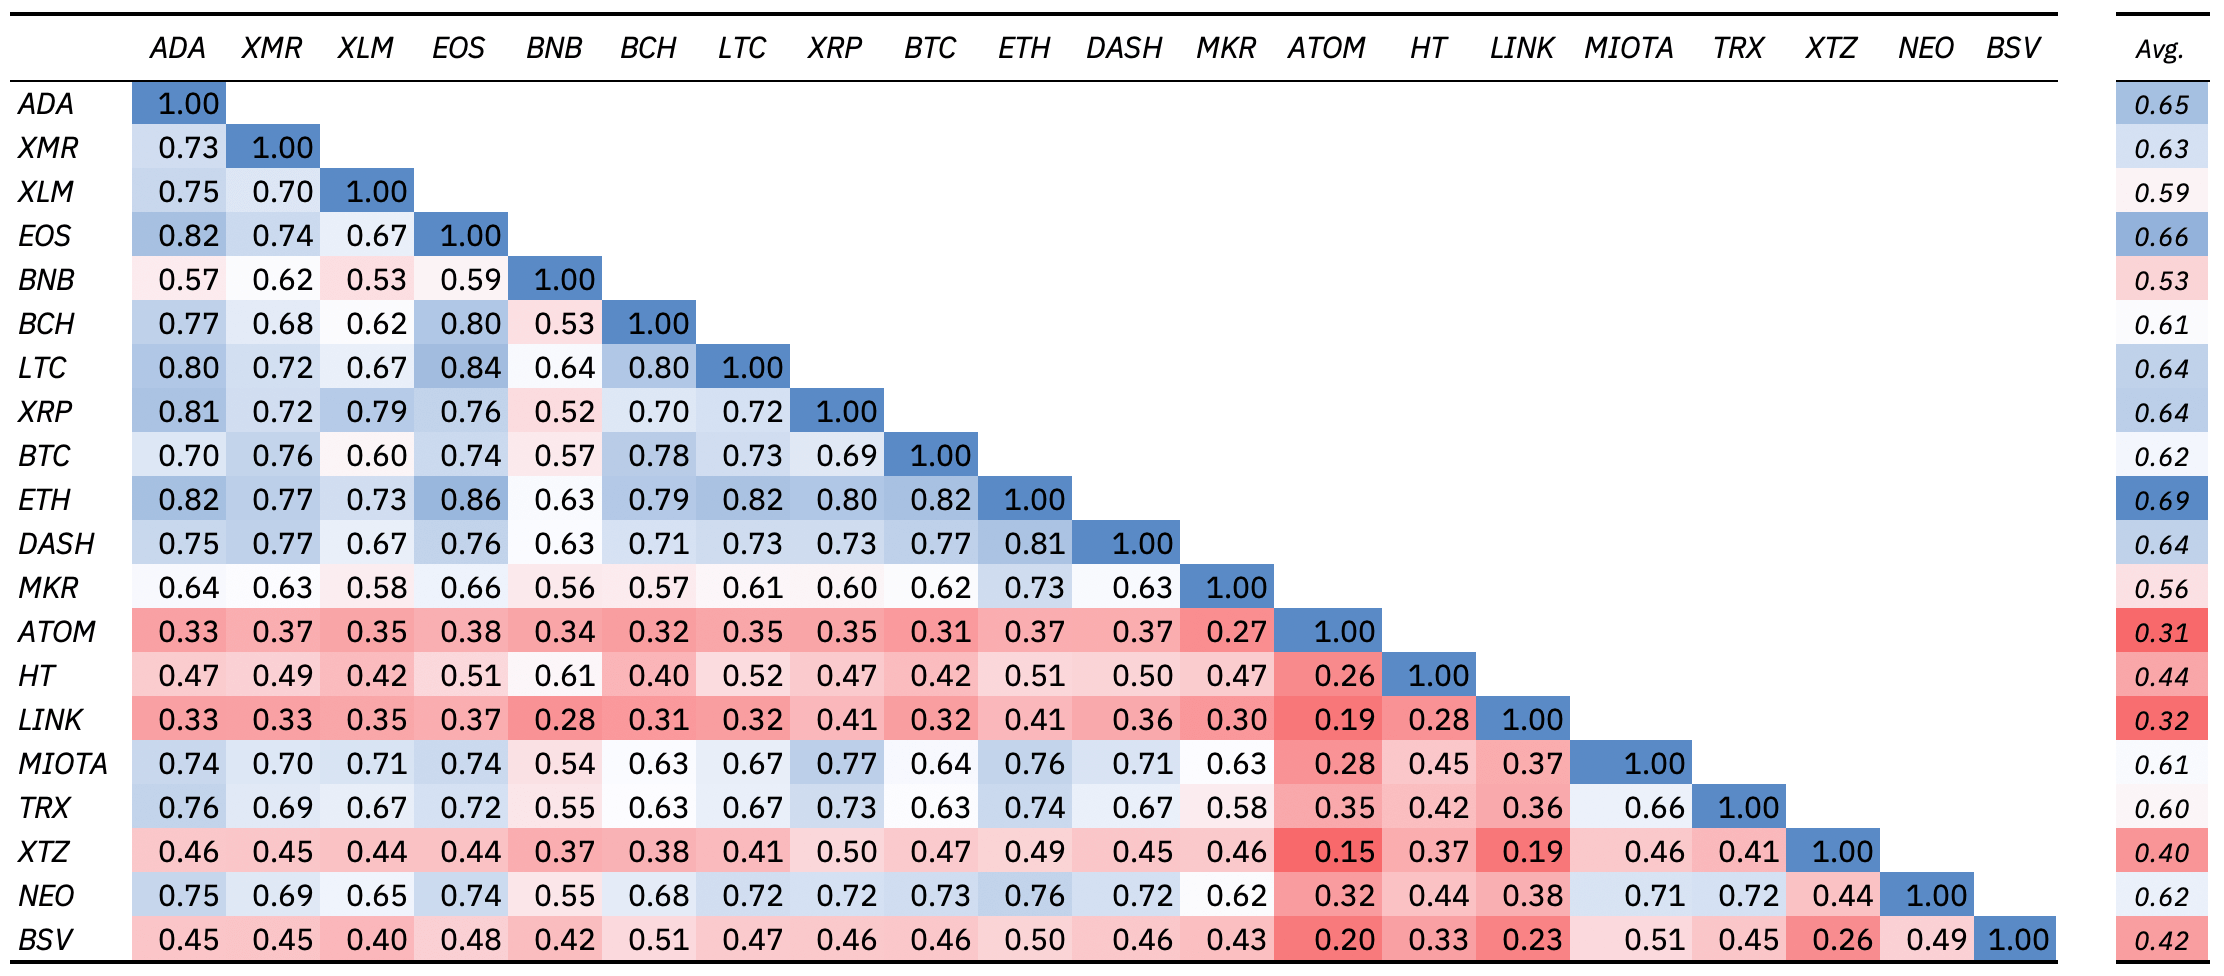
Assets with a correlation above 0.5 have a strong positive linear relationship. Conversely, assets with a correlation below -0.5 are considered to have a strong negative association, which indicates that they move in opposite direction to the rest of the market. If the correlation coefficient is 0, this implies that there is no observable linear relationship between the two assets.
According to a recent Binance report, the lowest correlated assets in the cryptocurrency market are Cosmos (ATOM), Chainlink (LINK), and Tezos (XTZ). Throughout 2019, these cryptocurrencies displayed a correlation coefficient of 0.31, 0.32, and 0.40, respectively. But, there are other factors to consider, as the report reads:
“One differentiating factor between Cosmos and the other large-cap cryptoassets is the listing time – Cosmos only got launched and listed during the end of Q1 2019. As the median correlation of ATOMs appears to be increasing – annual corr. coeff. of 0.31 for 2019 with a coefficient of 0.56 for Q4 2019 -, the lower listing time might be one factor to explain this phenomenon.”
The fact that these three cryptocurrencies moved opposite to Bitcoin during 2019 makes them useful as a hedge against it. Under this premise, analyzing their price behavior could provide some insights on where the pioneer crypto is heading next.
Cosmos (ATOM)
Cosmos is contained within a parallel channel since Jan. 19. Since then, every time this cryptocurrency plunges to the bottom of the channel, it bounces off to the middle or the top. But, when it surges to the top of the channel, it pulls back to the middle or the bottom.
Due to the inability to determine whether ATOM could breakout to the downside or to the upside, the trading range between $4.38 and $4.68 is a reasonable no-trade zone. Closing below or above this area will define the direction of the trend.

An increase in the amount of sell orders behind Cosmos could push it to break the support level. Moving below this significant price hurdle, could send this cryptocurrency down to the 38.2 percent Fibonacci retracement level that sits at $4.05.
Conversely, a spike in demand for ATOM that allows it to breakout of the current consolidation period could take it to retest the recent high of $5.38.
Chainlink (LINK)
Like Cosmos, Chainlink’s price action is also contained in a no-trade zone since trading within this area poses a high level of risk. In fact, LINK has been consolidating between the 50 and 61.8 percent Fibonacci retracement levels since Jan. 27. These levels sit at $2.60 and $2.66, respectively.
Closing below the 50 percent Fibonacci retracement level could push Chainlink to the next level of support that sits at $2.54. However, a move above the 61.8 percent Fibonacci retracement level could allow it to surge to $2.76 or higher.
Tezos (XTZ)
On Jan. 28, Tezos went from trading at a high of $1.57 to a low of $1.51. The sudden 3.55 percent nosedive created a bearish engulfing candlestick on XTZ’s 4-hour chart. This technical pattern is considered a bearish formation that is likely to reverse the bullish trend seen over the last few days. The bearish outlook will be confirmed once the succeeding candlestick closes below the engulfing one.
An increase in the downward pressure around the current price levels could take XTZ to breakout of an ascending parallel channel where it has been trading since Jan. 25. Such a bearish impulse would likely trigger a steep correction.
Nonetheless, the ascending parallel channel could continue to hold. If so, then Tezos could bounce off the lower boundary of the channel to the middle or the upper boundary.
Factors to consider
While Cosmos, Chainlink, and Tezos are contained within a consolidation period, Bitcoin recently failed to break above the $9,000 resistance level once again. Now, the pioneer cryptocurrency appears to be bound for a retracement.
The TD sequential indicator presented a sell signal in the form of a green nine candlestick on BTC’s 6-hour chart. This technical index estimates a one to four candlesticks correction or the beginning of a new downward countdown. A red two candlestick trading below a preceding red one candle could confirm the bearish outlook.
Additionally, an evening doji star candlestick pattern appears to be developing within the same time frame. This is a bearish reversal formation that occurs at the top of an uptrend.
Evening doji stars are composed of three candlesticks: a long green candle, a short candle, and a red candle. The combination of these three candlesticks indicates that BTC is losing its bullish momentum and could enter a corrective period.
Assuming that Cosmos, Chainlink, and Tezos are the most uncorrelated assets to Bitcoin, one could argue that if the flagship cryptocurrency retraces then these three cryptos could surge. If this is the case, such a dissociation would be important to have in mind when building a crypto portfolio.