Research: Asia, EU, US are bullish on Bitcoin, Ethereum
The regional price metrics for Bitcoin and Ethereum show that all three regions are bullish on both assets, while they favor Bitcoin more.
Cover art/illustration via CryptoSlate. Image includes combined content which may include the use of AI tools.
Glassnode data analyzed by CryptoSlate analysts shows that Asia, the U.S., and the EU have been bullish on Bitcoin (BTC) and Ethereum (ETH) since late January.
As the regional price metrics indicate, investors from all three regions feel more bullish on BTC than they do on ETH. In the meantime, year-over-year BTC supply for Asia means BTC will continue to increase in the short term.
Regional prices
The regional price metric used in this research shows the 30-day change in the regional prices of Asia, the EU, and the U.S. The price movements during the working hours of a region must be recorded before calculating the regional price metric. Then, the price for a region can be determined by calculating the cumulative sum of the price changes recorded within the working hours of that region.
The chart below reflects the regional BTC prices for all three regions since the beginning of 2022. The red bars represent the regional price for the U.S., while the blue and green ones represent the EU and Asia, respectively.
If the metric falls below the zero line, this indicates that the region is bearish on BTC. If it places above the line, it represents the region's bullish sentiment.
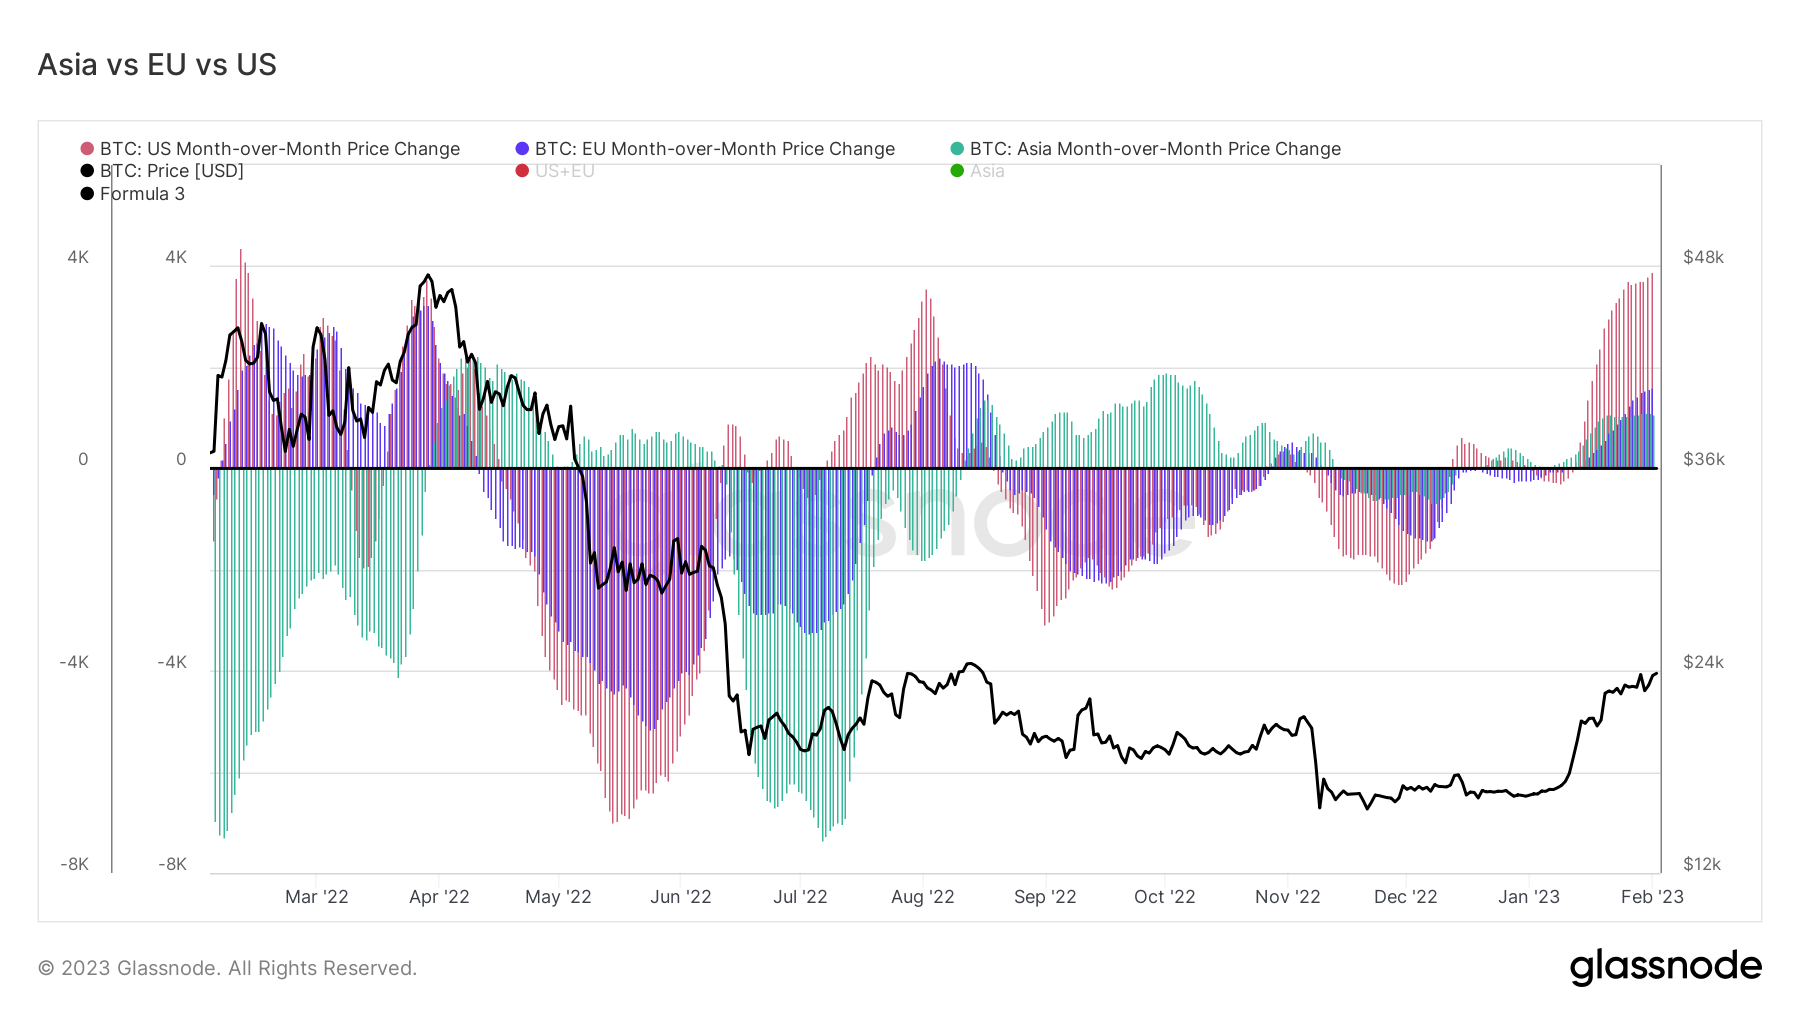
According to the chart, that all three regions turned on the bullish side in late January 2023 and have been bullish since then, with the U.S. being the most bullish. The last time all three regions were bullish was during a short time in August 2022, right after the Luna collapse.
Ethereum
The regional ETH prices for Asia, the U.S., and the EU also represent a similar bullish sentiment. The chart below illustrates the regional ETH prices for each region since the beginning of the year 2022. The U.S., the EU, and Asia are represented with red, blue, and green, respectively.
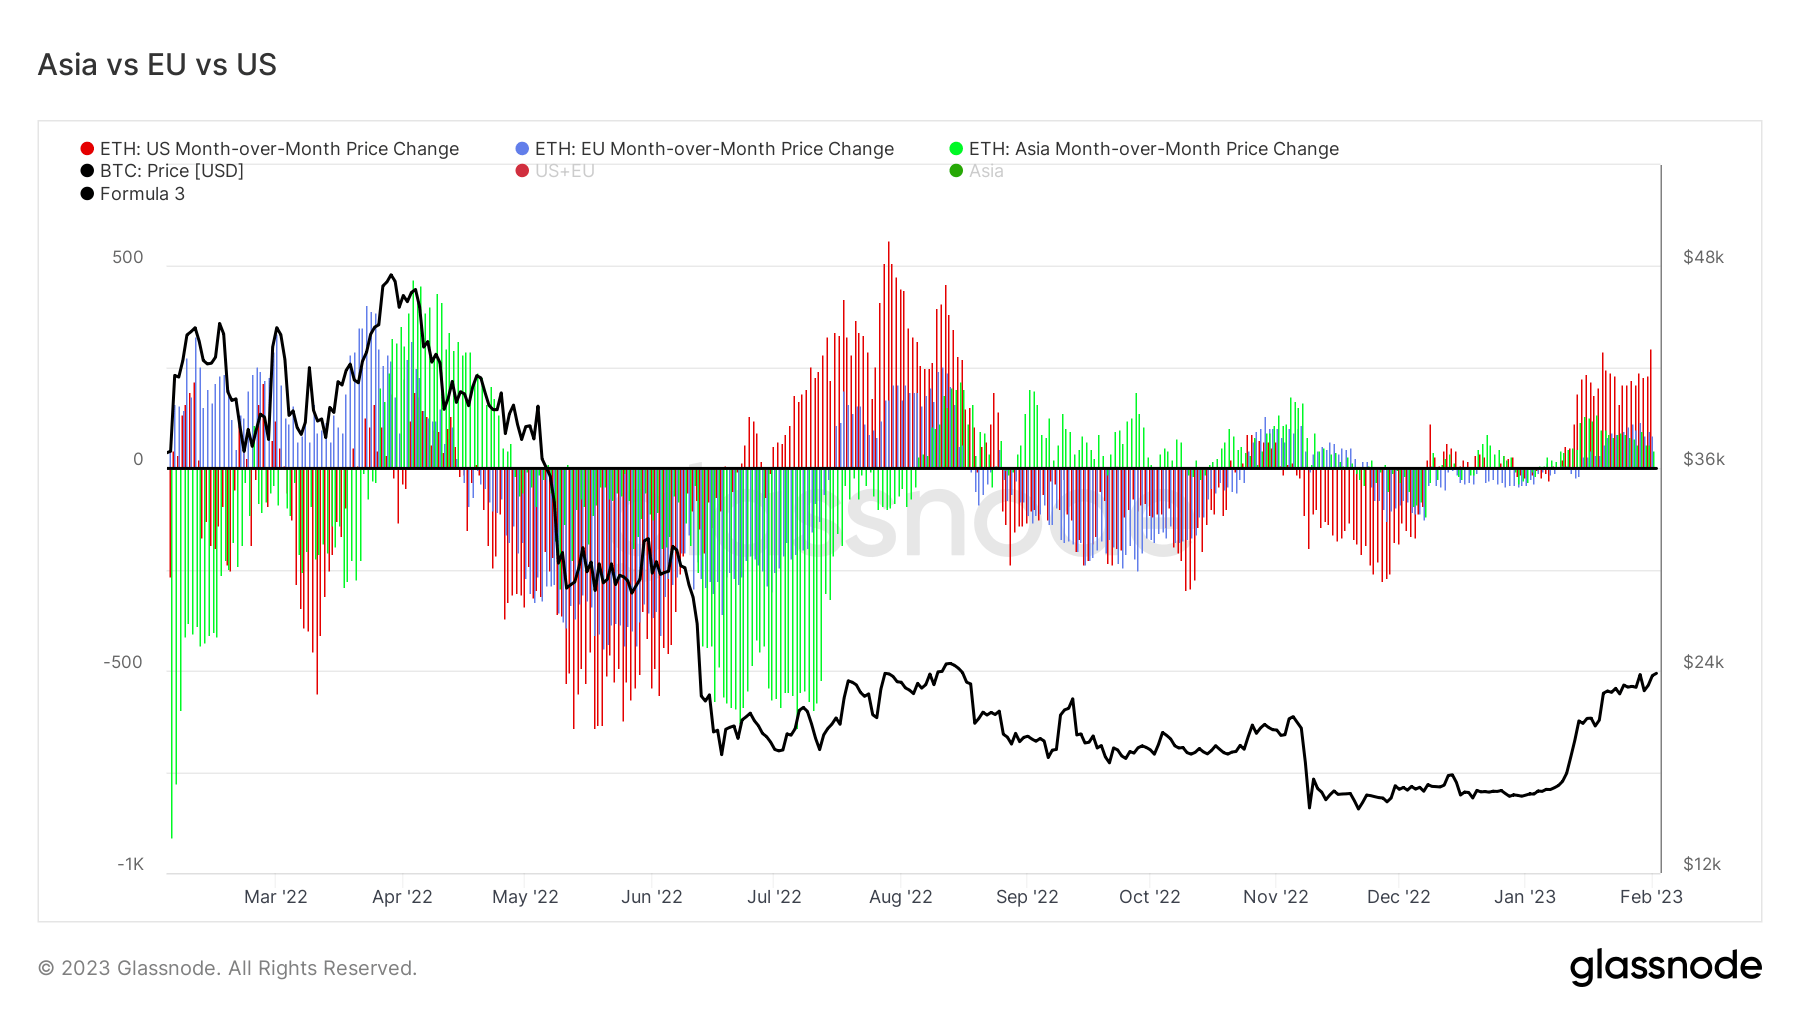
Similar to the regional BTC prices, all three regions currently appear bullish on ETH, with the U.S. being the most bullish one. However, none of the regions show the same level of enthusiasm as they do with BTC.
Year-over-Year supply of Asia
This metric provides an estimate for the year-over-year (YoY) change in the market share between the BTC supply held and being traded. The chart below shows the YoY supply for the Asia region since the beginning of 2010.
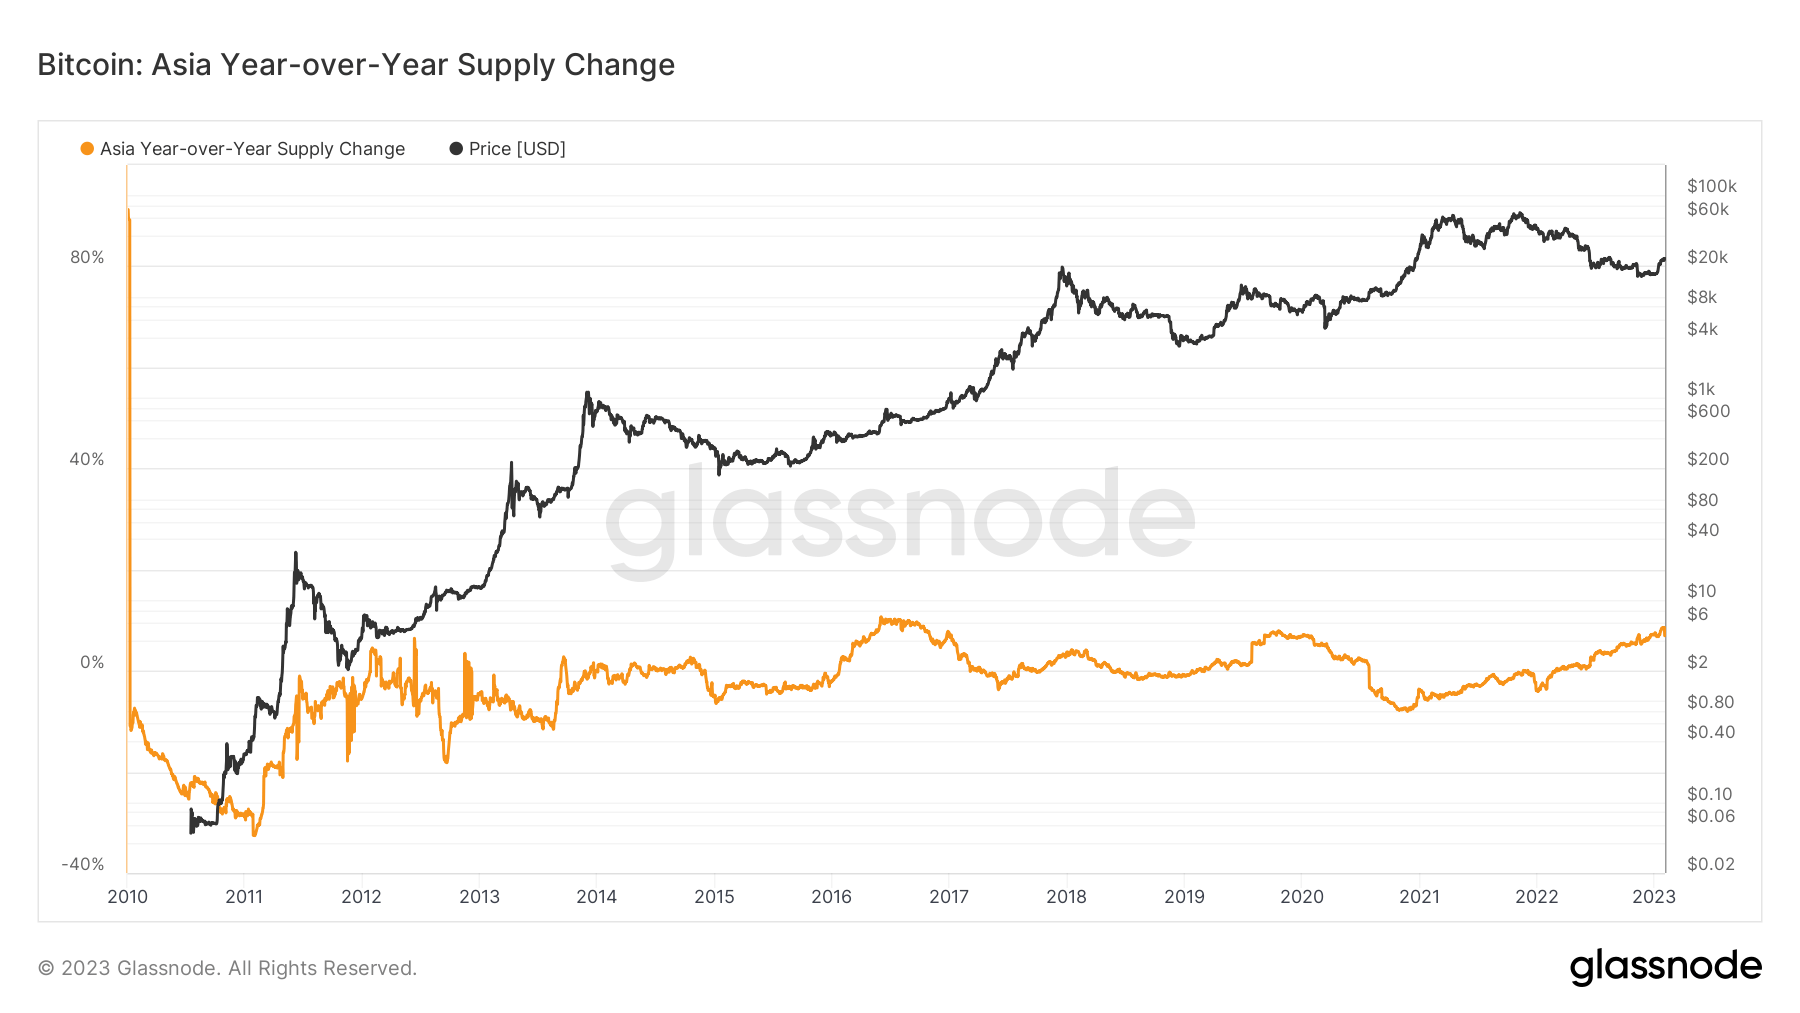
The data shows that the region's YoY supply is currently over 8.5%. This percentage indicates that Asia is at the highest bullish point it has ever been.
Previous CryptoSlate research revealed that Asian investors built and maintained a smart money reputation by consistently buying at the bottom and selling at the top. Assuming Asiacontinuesg to act “smart,” their bullish sentiment indicates that BTC will continue to increase, at least in the short term.