


Quick Take
- Bitcoin climbed above $84,000 while Ethereum reclaimed $2,500 as both cryptocurrencies extended their weekend recovery.
- Bitcoin approaches a dense $84,000–$85,000 acquisition-cost zone; Ethereum still had 10.58 million ETH of futures open interest in an Oct. 10 snapshot.
- A failed Bitcoin breakout could expose $77,000–$79,000 support, while renewed ETH volatility risks triggering fresh liquidations.


Bitcoin and Ethereum extended their weekend recovery, although on-chain indicators and derivatives positioning suggest the rebound faces significant obstacles.
Data from CryptoSlate showed that Bitcoin briefly climbed above $84,000 after falling toward $80,000 during last week's selloff. Ethereum also recovered above $2,500, reversing part of its recent losses as buying activity returned to the cryptocurrency market.
However, Bitcoin's advance has brought it closer to a major concentration of investor acquisition costs between $84,000 and $85,000, where selling pressure could intensify. Meanwhile, Ethereum's recovery comes as larger derivatives traders appear to be reducing their bullish exposure despite substantial outstanding positions.
Bitcoin's $85,000 resistance threatens to stall recovery
Bitcoin's recovery gained momentum during Sunday's trading session as traders appeared to capitalize on a liquidity concentration above the prevailing market price.
CryptoQuant analyst J.A. Maartunn said on Oct. 11 that a liquidity cluster formed just above Bitcoin's trading level, giving traders an opportunity to push prices higher.
According to Maartunn, traders appeared to establish a substantial wall of buy orders beneath the market, providing support as Bitcoin advanced toward the overhead liquidity.
The spot Bid/Ask Ratio, which measures buying and selling liquidity within 1% of the prevailing price, rose to 0.3.
The increase indicated that visible buying interest had strengthened relative to selling orders. Such liquidity can also disappear if traders cancel their orders.
Checkonchain data highlighted by analyst Darkfost on Oct. 11 showed that approximately 53% of Bitcoin's invested capital had an estimated acquisition price above $83,000 when the cryptocurrency traded around that level.
The measure weights acquisition prices by invested capital, so larger positions carry more weight.
More importantly, the largest concentration of acquisition costs sits between $84,000 and $85,000, making the region a potential obstacle to further gains.
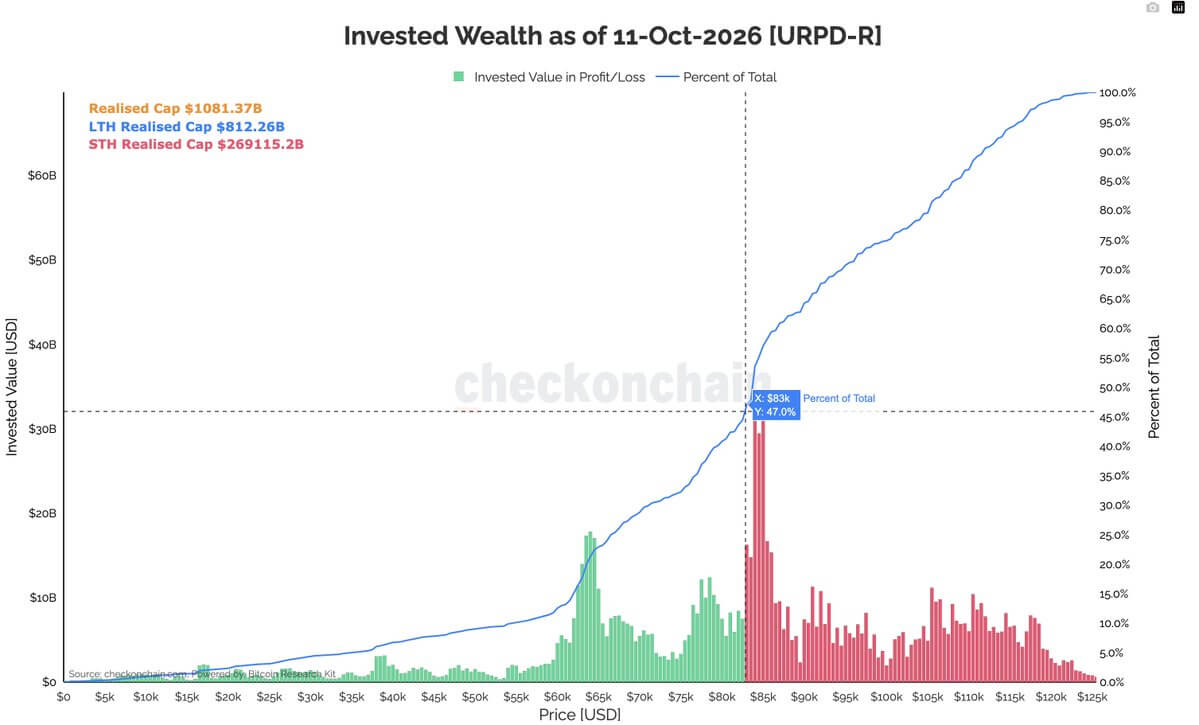
Investors who acquired Bitcoin around those levels could become more willing to sell as prices approach their estimated cost basis, increasing the supply that buyers must absorb.
A sustained move through the region would suggest buying demand is strong enough to overcome that potential selling pressure. If it fails to do so, Bitcoin could be vulnerable to another decline, with Darkfost identifying the $77,000 to $79,000 range as a possible support area.
Ethereum's $2,500 rebound faces risk from leveraged traders
Ethereum's recovery faces another challenge as derivatives positioning among larger market participants continues to deteriorate.
Alphractal CEO Joao Wedson noted on Oct. 10 that Ethereum's 30-day and 180-day open-interest deltas were both negative, along with weakening readings in its Whale vs. Retail Delta indicator.
He interpreted the combination as evidence that major traders have reduced their bullish exposure while increasingly favoring defensive or short positions.
The negative open-interest readings indicate that outstanding derivatives positions have contracted over the measured periods.
Despite the contraction, Ethereum's total futures open interest remained substantial at approximately 10.58 million ETH, indicating that considerable derivatives exposure was still outstanding.
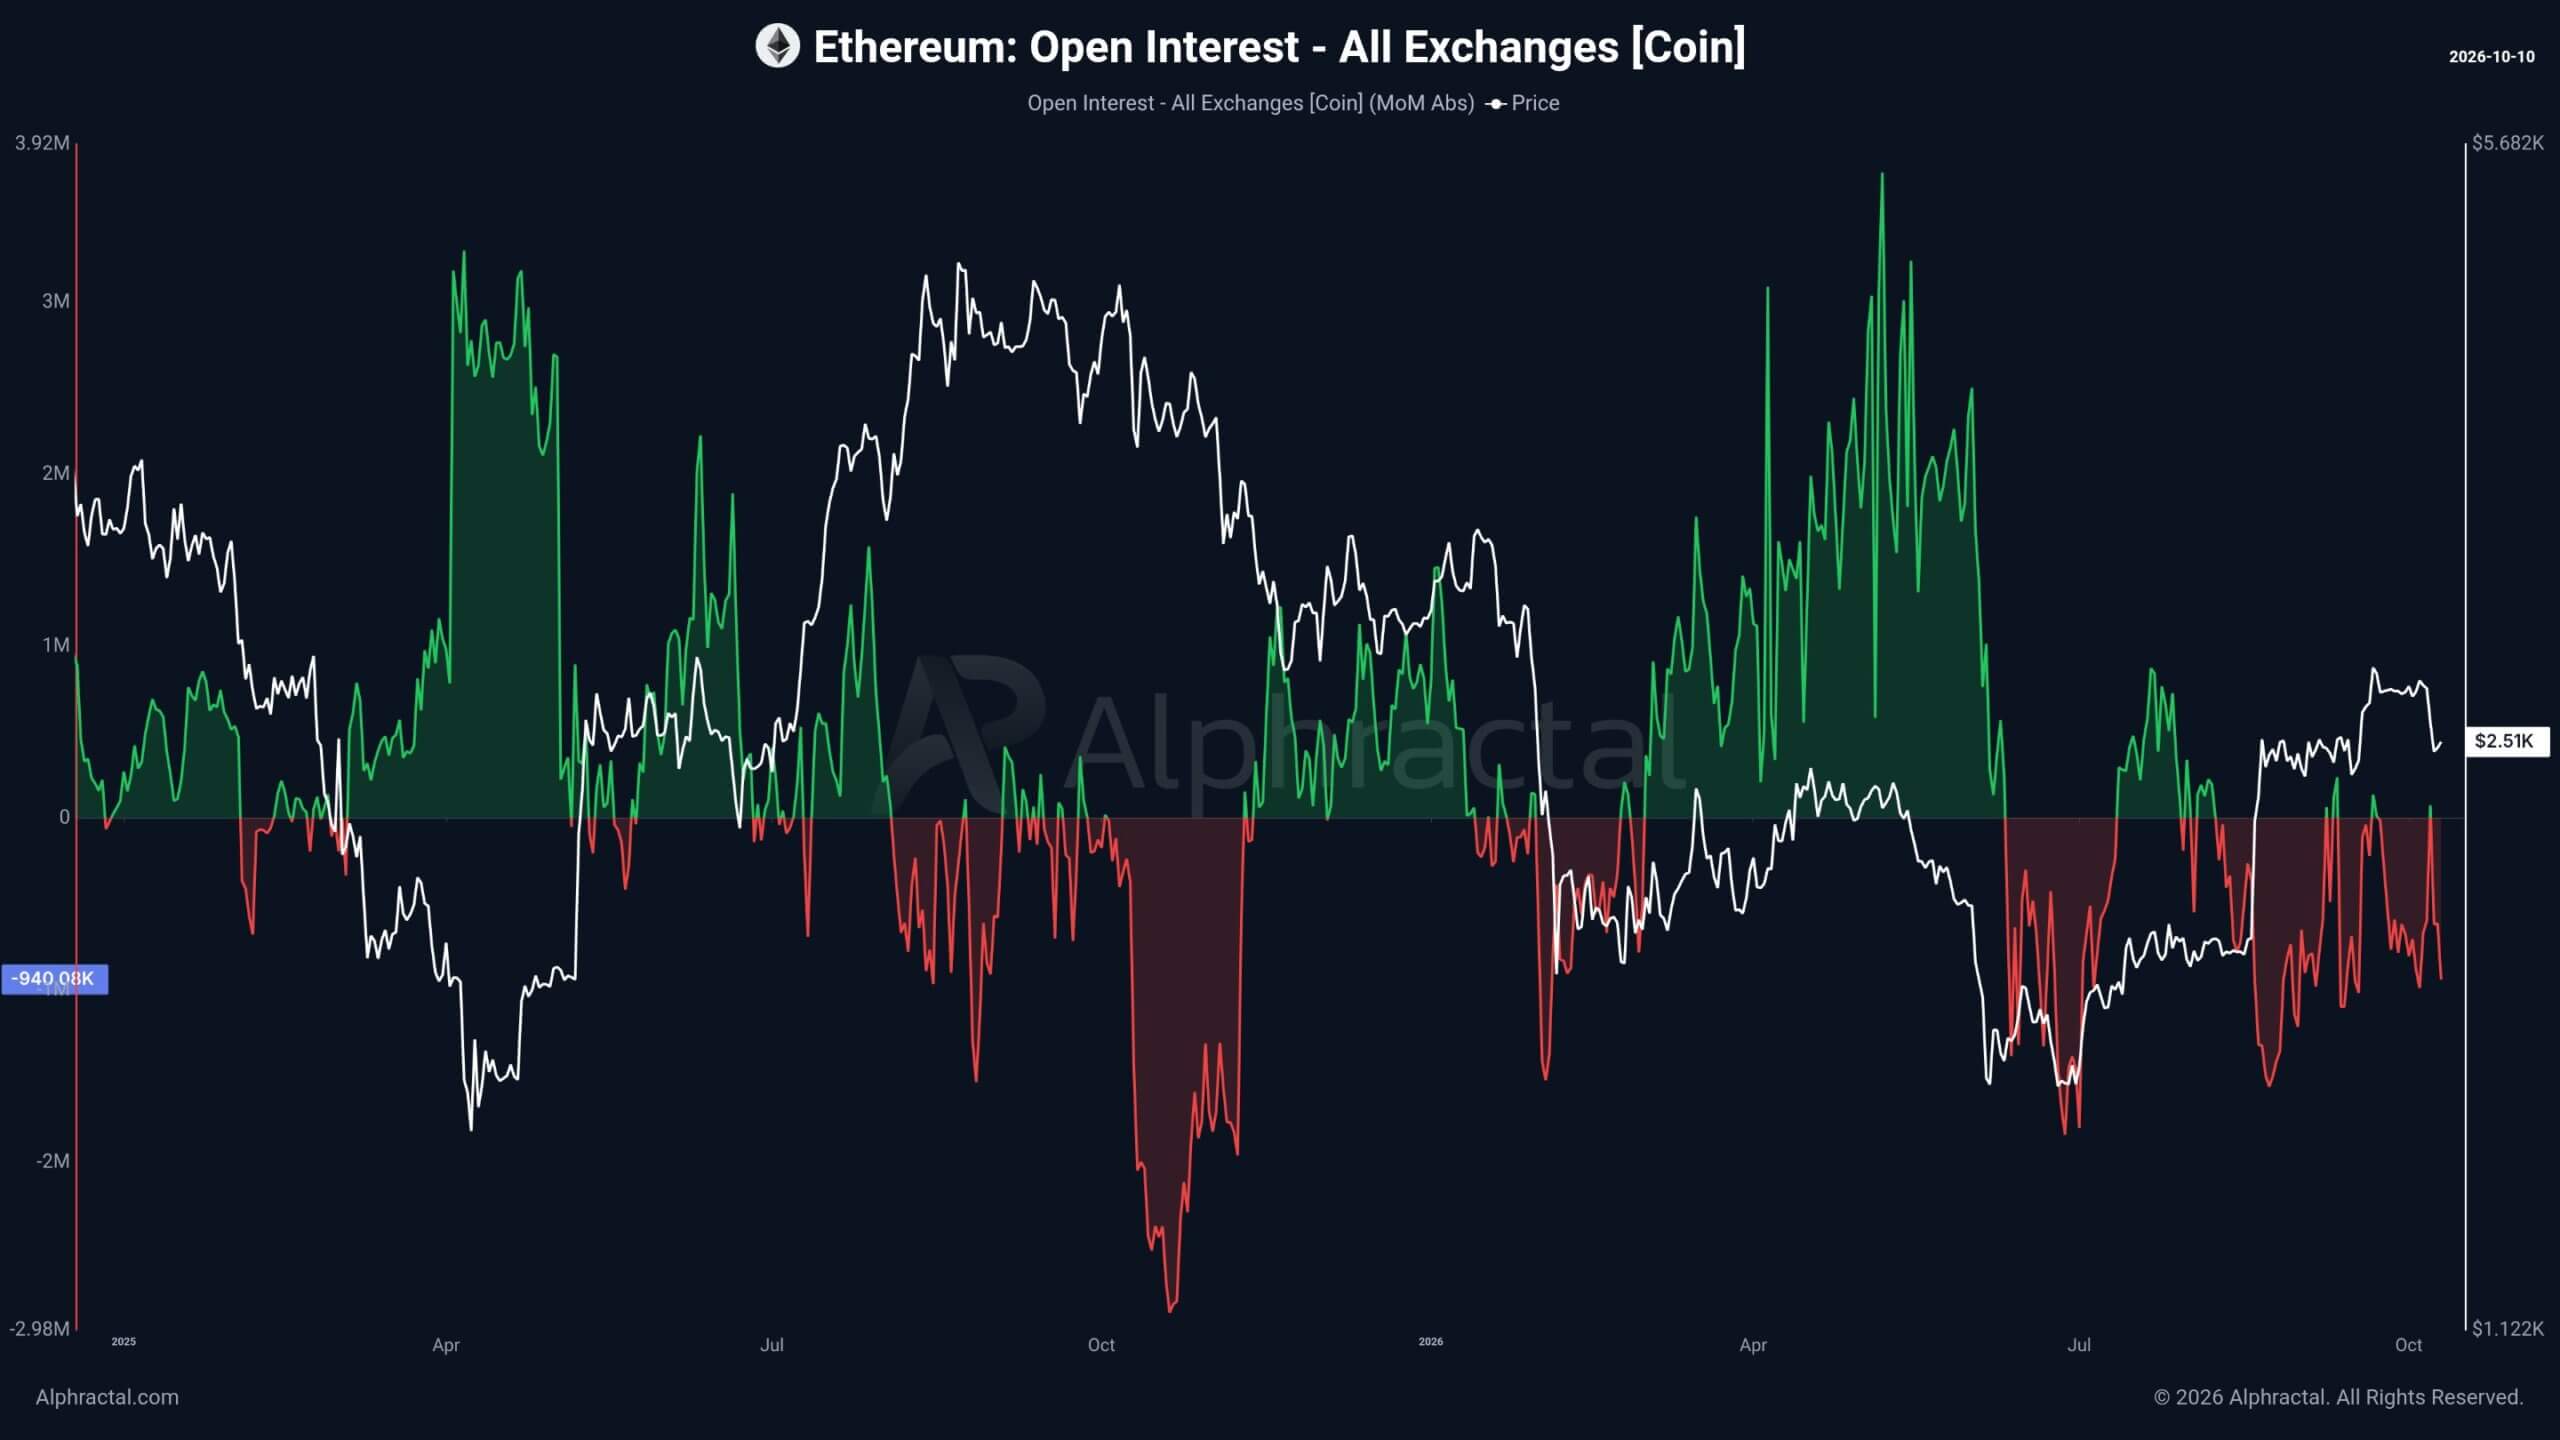
Valued at $2,500 per ETH, that represents roughly $26.5 billion in notional exposure.
The combination of weakening bullish positioning and substantial remaining exposure increases the potential for sharp price movements if volatility returns.
A renewed decline could push leveraged long positions toward forced liquidation, potentially adding selling pressure and accelerating losses. Conversely, a sustained recovery could force short sellers to close positions, contributing to further upward momentum.
Wedson warned that Ethereum's derivatives market remains vulnerable to further liquidations despite the recent reduction in outstanding positions.

Bitcoin is -0.83% over the past 24 hours and currently sits at rank #1 by market cap.
Mentioned in this article


Editorial credits