


Quick Take
- A September preprint finds cheaper quiet-market SOL/USDC fills at professional pools, using a retail proxy rather than verified identities.
- Two-second maker markouts measure pricing risk, while passive depositor returns need fees, inventory and other position-level costs.
- Reconstructed Tessera quotes on Base diverged from fills, highlighting a routing test separate from Solana’s execution-price comparison.


A trader can get a better Solana (SOL) swap price while a passive pool depositor remains exposed to traders picking off stale quotes, and a Sept. 29 preprint measures that divide.
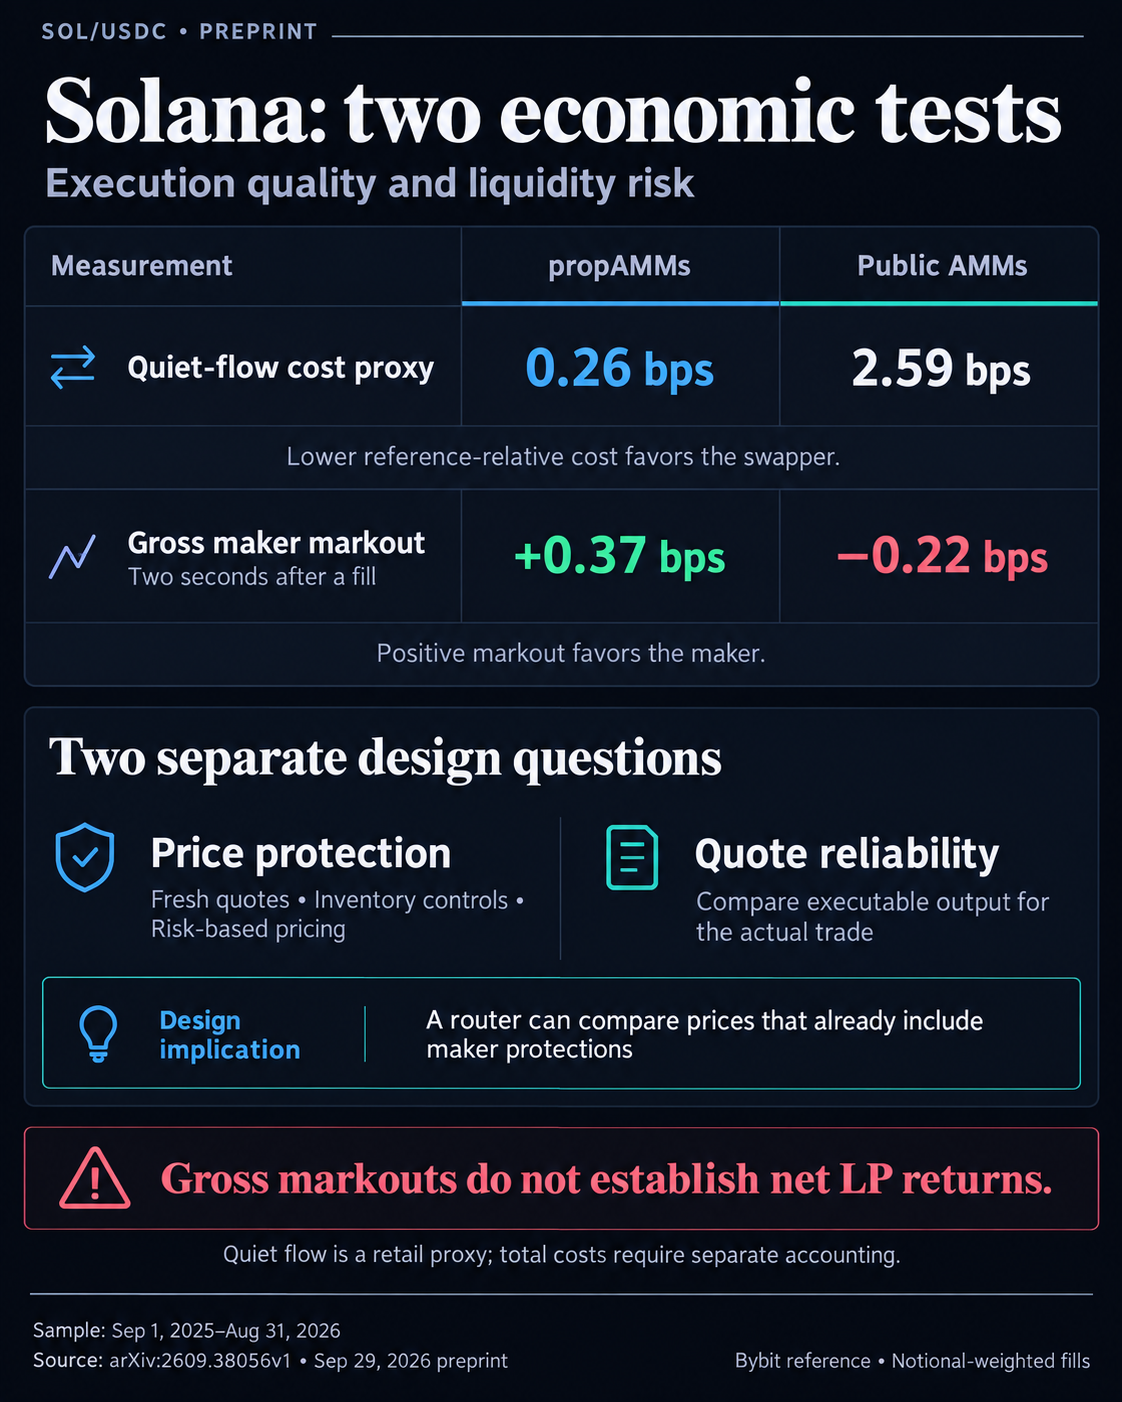
For quiet-market SOL/USDC fills, propAMMs, pools controlled by professional operators, had a reference-relative execution cost proxy of 0.26 basis points versus 2.59 for public automated market makers (AMMs).
The study covers Sept. 1, 2025, through Aug. 31, 2026, with shorter Base and Monad samples. It weights fills by notional against Bybit's size-weighted top-of-book USDT microprice, converted with its USDC/USDT midpoint. Its authors list ETH Zurich and Category Labs affiliations.
A swapper wants more tokens for the same input, while a depositor supplies the inventory others trade against and needs compensation for the risks that inventory carries. Low execution cost can attract the first participant without being a sufficient investment case for the second.
Swap prices and depositor returns on Solana
Across its Solana sample, the paper reports two-second gross maker markouts of +0.37 basis points for propAMMs and −0.22 for public AMMs. A markout compares a fill with a later reference price, and a positive number favors the maker.
Quiet-flow execution asks how much a trader gives up against a relatively stable reference. The proxy requires less than 1 basis point of reference movement from five seconds before to one second after a fill.
Maker markouts ask what happens to a trade's value after the pool accepts it. Mixing the measures would turn evidence about pricing and adverse selection into a profitability claim the numbers cannot support.
When an outside market moves first, a pool still offering an old price can sell too cheaply or buy too dearly. An arbitrageur brings the prices back into line, but the correction comes through a trade against the liquidity already sitting in the pool.
Loss-versus-rebalancing research treats that arbitrage cost as one component of LP economics. Returns also reflect asset exposure and fees earned, so an investment assessment needs a position, a holding period, and the income and costs attributable to it.
Trading fees need to be allocated correctly, while inventory changes, hedging, operating expenses and transaction costs also matter when applicable. The short horizon leaves that accounting unresolved, and venue averages cannot establish that professional pools caused aggregate passive-LP losses.
Depositors need a return assessment that includes this wider balance sheet, and swappers can benefit from liquidity whose operator actively manages pricing risk.
Jump Crypto's April account describes propAMMs, including its own BisonFi, adapting prices and available liquidity to inventory, quote freshness, and the quality of incoming flow. Jump is an interested operator, and implementations differ.
A maker holding too much of an asset can discourage trades that add more of it, while a stale price can justify withdrawing depth or widening a fee. A routing path associated with adverse selection can receive different terms from flow the maker considers less risky.
Economically, those controls can allow a maker to quote more tightly when it expects less risk. Requiring every counterparty to receive identical terms would remove one way of distinguishing that risk. The price an ordinary swapper ultimately receives would still need to be measured.
Jupiter's AMM integration documentation shows that a dedicated signer identifies trades originating at its frontend, describing that flow as retail and non-toxic. However, identifying origin is different from independently establishing that every trade is harmless to the maker.
Private market-making logic can sit behind public settlement. The ability to defend a price may help a firm offer cheaper liquidity, while access to that price depends on the actual route and counterparty.
Quote reliability is a separate test
For Tessera on Base, execution averaged 1.08 basis points worse by trade and 0.56 by volume than reconstructed previous-block-end quotes. Researchers call the block-timed fee pattern “spoofing.”
The researchers compare reconstructed pool output with execution, leaving individual screen quotes outside the measure. The observed pattern provides no direct evidence of operator intent. Better execution relative to a market reference and worse execution relative to an earlier quote can coexist.
In a March 20 report, routing provider 0x described Base prices deteriorating between quote selection and settlement through block timing and spread changes. Its operators were unnamed, so that report cannot identify Tessera as the subject. 0x also stated a policy of cutting off sources until execution issues are remedied.
If an advertised output attracts the order but a different output is delivered, competition on the advertised number can reward the wrong venue. The question becomes whether routers compare what a trader can receive under the conditions of that transaction.
Jump argued that routers selecting executable prices when transactions run can largely close the display-to-fill gap. The useful design implication is that a maker could retain inventory, freshness, and counterparty protections, provided the router compares outputs that already include them.
Jupiter's current Swap API overview describes competition between routing engines and a mechanism that sidelines underperforming sources. Its integration guide also requires quote/execution parity tests against the same pool snapshot.
A parity check measures agreement on one snapshot, but persistence through later updates is a separate question. Competition between engines also leaves open whether each venue is reconsidered within an executing transaction.
Comparing executable output offers a design direction, but its effectiveness would need to be measured.
For a meaningful comparison, the executable output must reflect the same trade size, caller, current pool state, and applicable charges. Otherwise, a price available to one routing path can be mistaken for a price available to another.
Jupiter documents a platform swap fee on its Meta-Aggregator path and none on its Router path, while integrator fees and landing arrangements can differ. A protocol-level spread cannot stand in for the amount ultimately received after all applicable charges.
The next useful evidence would compare quoted and delivered output on matched transactions, explain which costs are included, and show how routing treats persistently underperforming sources.
For passive liquidity, a separate position-level return assessment is needed. Better routing can improve the swapper's decision while leaving the depositor's investment question open.

Solana is +2.94% over the past 24 hours and currently sits at rank #7 by market cap.
Mentioned in this article





Editorial credits