Why viral public whale liquidations are becoming a real trading signal on Hyperliquid
Hyperliquid's transparent liquidation data turned one whale's repeated ETH wipeouts into a real-time signal traders can track and react to.

Quick Take
- Lookonchain said Machi Big Brother's Hyperliquid ETH long was liquidated seven times in 10 hours while still holding positions.
- Because Hyperliquid exposes address-level activity and liquidation maps, traders can watch the same vulnerable price zones in real time.
- That visibility may shape short-term trading, but it does not show whether ETH will hit the level or the whale will add margin.
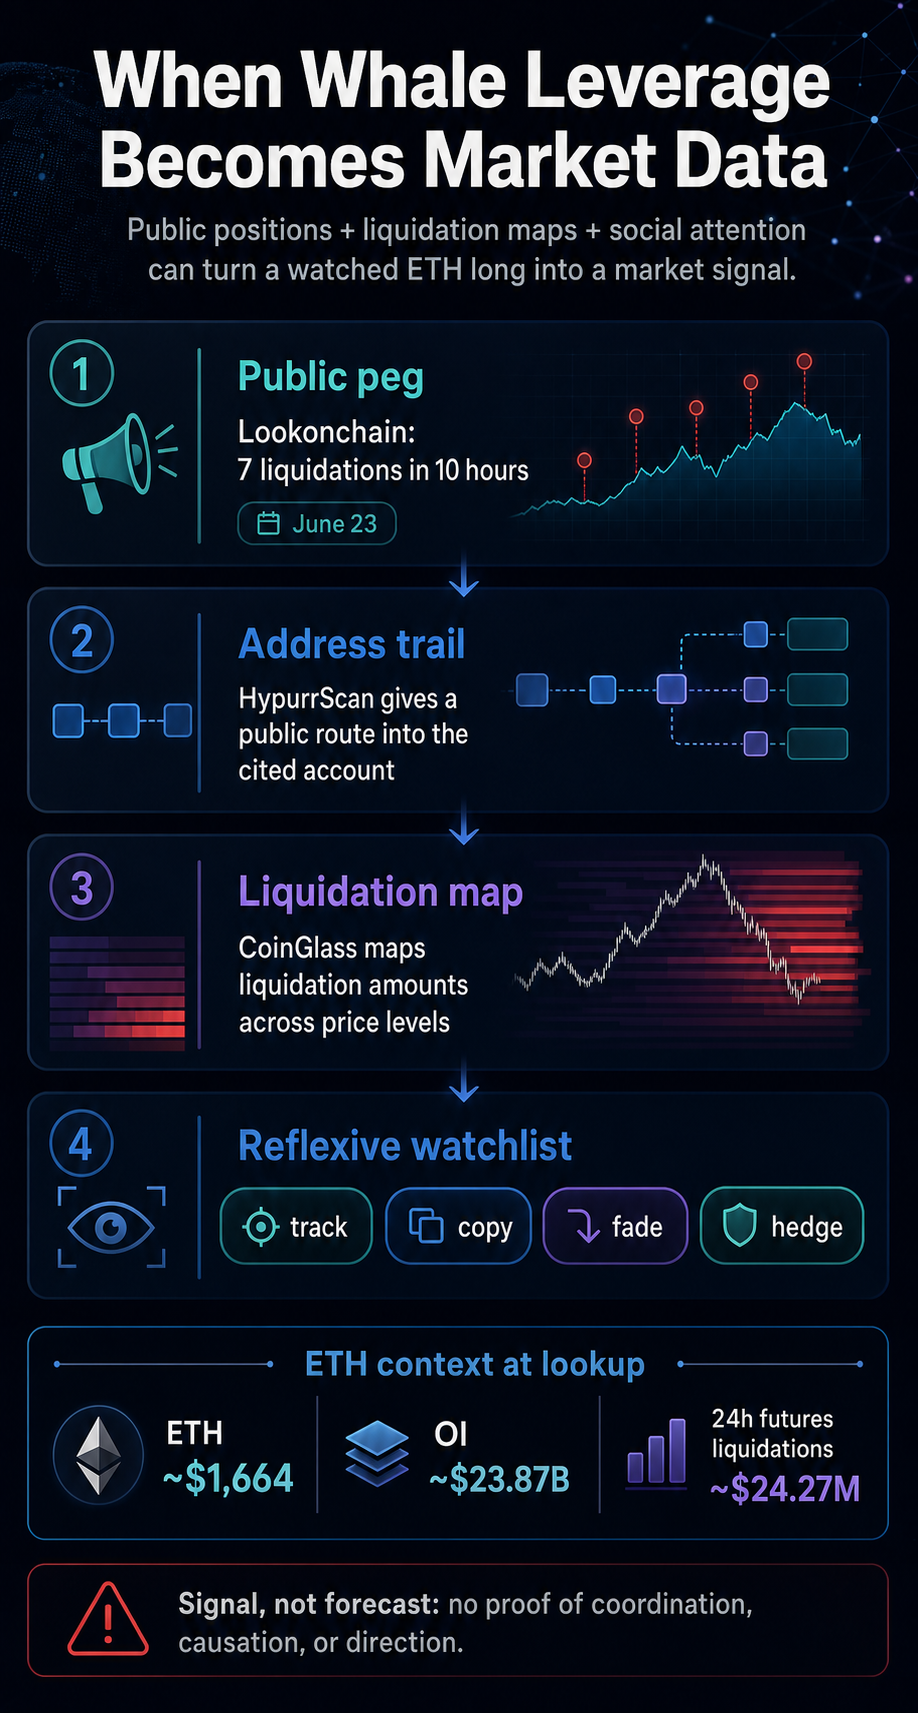
A highly watched Hyperliquid ETH long has become a public stress point for traders tracking whale leverage in real time. On June 23, Lookonchain said the account it identified as Machi Big Brother was liquidated 7 times over 10 hours while still holding long positions.
Seven forced exits in one 10-hour window would usually be a trader-specific blowup. On Hyperliquid, the public address route, liquidation maps, and social attention can all point the market toward the same vulnerable price zone.
In that sort of setup, the whale becomes both a trader and a data point.
We're currently experiencing a liquid but unsettled ETH market. CryptoSlate's Ethereum market page showed ETH at $1,607 on June 24, down 3% over 24 hours, with a market cap near $194 billion and a 24-hour volume near $13.5 billion.
CoinGlass's ETH derivatives page also shows open interest near $22.7 billion and 24-hour futures liquidations near $213 million as of press time. Those figures suggest correlation rather than causation, and they explain how a visible liquidation level becomes a focal point in a market where leverage, attention, and price can react to one another.
Why visible leverage on Hyperliquid changes the setup
Hyperliquid is one of the clearest venues for tracking large perp traders because account-level activity can be analyzed alongside market data tools. The HypurrScan address page cited in connection with the Lookonchain claim provides a public entry point.
CoinGlass' Hyperliquid liquidation map presents liquidation amounts and price distributions across levels. That turns forced-exit risk into something traders can watch in advance, not only something they read about after a cascade.

The mechanism is simple. A leveraged long has a price where the position can be forced out. If that level is visible, other traders can monitor it.
If enough traders monitor it, the level can attract more attention than it would have if the position stayed private. Some traders may use it as a risk marker. Others may try to fade the crowd or copy the same direction until the position becomes part of a public narrative.
None of that requires a conspiracy. It only requires a shared screen.
The public aspect also changes the meaning of speed. A liquidation level that once belonged mainly to the trader and the venue can now circulate through dashboards, screenshots, X posts, and chat rooms before the price gets there.

The result is a faster feedback loop in which more traders can decide whether the level is a warning, an opportunity, or noise.
That makes the position useful even to traders who never intend to follow it. A watched liquidation band can serve as a reference for stop placement, hedging, and risk reduction, yet it offers no guarantee that the price will touch that level.
The public value is the shared visibility, not any promise of direction.
The Hyperliquid signal still has limits
Public whale watching offers some relevant signals, but it's usually a poor forecast. A visible liquidation zone can tell traders where pressure may build. It leaves open whether the price will move there, whether the whale will add margin, whether the position will be closed, or whether the crowd is already leaning too far in one direction.
That is why the Machi episode works best as live market data rather than a celebrity-trader spectacle. It resurfaces the question of whether the public tracking of high-leverage accounts is changing how traders form short-term expectations on Hyperliquid.
CryptoSlate has covered related Hyperliquid and liquidation-map episodes from different angles. A March 2025 Hyperliquid incident demonstrated how a high-risk whale trade could lead to venue-level losses.
A June 2025 Bitcoin whale loss on Hyperliquid showed how large leveraged positions can turn specific price levels into public drama. For further reading, we've also covered how liquidation heatmaps can identify volatility zones before prices get there.

This is recurring behavior: traders watch more than price. They watch who can be forced to sell, where that forced selling might happen, and how many other people are watching the same level.
| Visible signal | What it can show | Limits |
|---|---|---|
| Lookonchain liquidation post | A public claim that the account was repeatedly liquidated while still long ETH | Trader motive, identity beyond attribution, or future behavior |
| HypurrScan address route | A public place to inspect the account path cited in connection with the claim | A static current position unless the page is refreshed at publication |
| CoinGlass liquidation map | Price zones where liquidation amounts cluster | Trader coordination or certainty that price must reach a level |
| Social attention | Whether a position is becoming part of the public trading conversation | Causation between attention and liquidation |
What to watch next
The most useful signal going forward is whether public data continues to change traders' behavior.
If the account reduces exposure, adds margin, or disappears from the discussion, the episode may remain a short-lived trading spectacle. If ETH trades toward visible liquidation clusters while the address remains widely watched, the setup becomes a clearer example of reflexive pressure, without proving coordination, causation, or direction.
That feedback loop is why public perp positions feel different from older whale-watching habits. A wallet transfer can hint at intent. A liquidation map tied to a watched perp position can show a possible trigger.
Once that trigger is shared across market dashboards and social feeds, the position becomes a reference point for risk managers, momentum traders, and spectators alike.
The risk is overstating what the data can say. Public liquidation levels alone fall short of a trading plan and do not make ETH's next move predictable. They do, however, change the information environment around a large position.
So the TL;DR is basically, public Hyperliquid whale positions are becoming a market signal when they combine address visibility, liquidation maps, and social attention. The signal offers no promise about direction. It is a visible weak point that traders can see, discuss, and trade around before the next liquidation headline arrives.