Research: BTC, ETH address momentum shows significant divergence
The new address momentum metrics indicate a sturdy network growth for BTC while showing an opposite sentiment for the ETH network.

Cover art/illustration via CryptoSlate. Image includes combined content which may include the use of AI tools.
Glassnode data analyzed by CryptoSlate shows that new address momentum metrics of Bitcoin (BTC) and Ethereum (ETH) reflect that the BTC network is growing while the sentiment on the ETH network is the opposite.
An uptick in daily active users, more transaction throughput, and increased demand for backspace often characterize healthy network adoption. Considering this, CryptoSlate analysts examined the new address momentum, new entity momentum, and active address momentum metrics for BTC and ETH.
New address momentum
The number of new addresses recorded on-chain can be an effective tool to measure the magnitude, trend, and momentum of activity across the network.
The absolute number of new addresses on any given day can be uninformative due to intraday volatility in on-chain activity metrics. Instead, comparing the magnitude and trend of new addresses entering the market on a monthly or yearly basis can be much more informative.
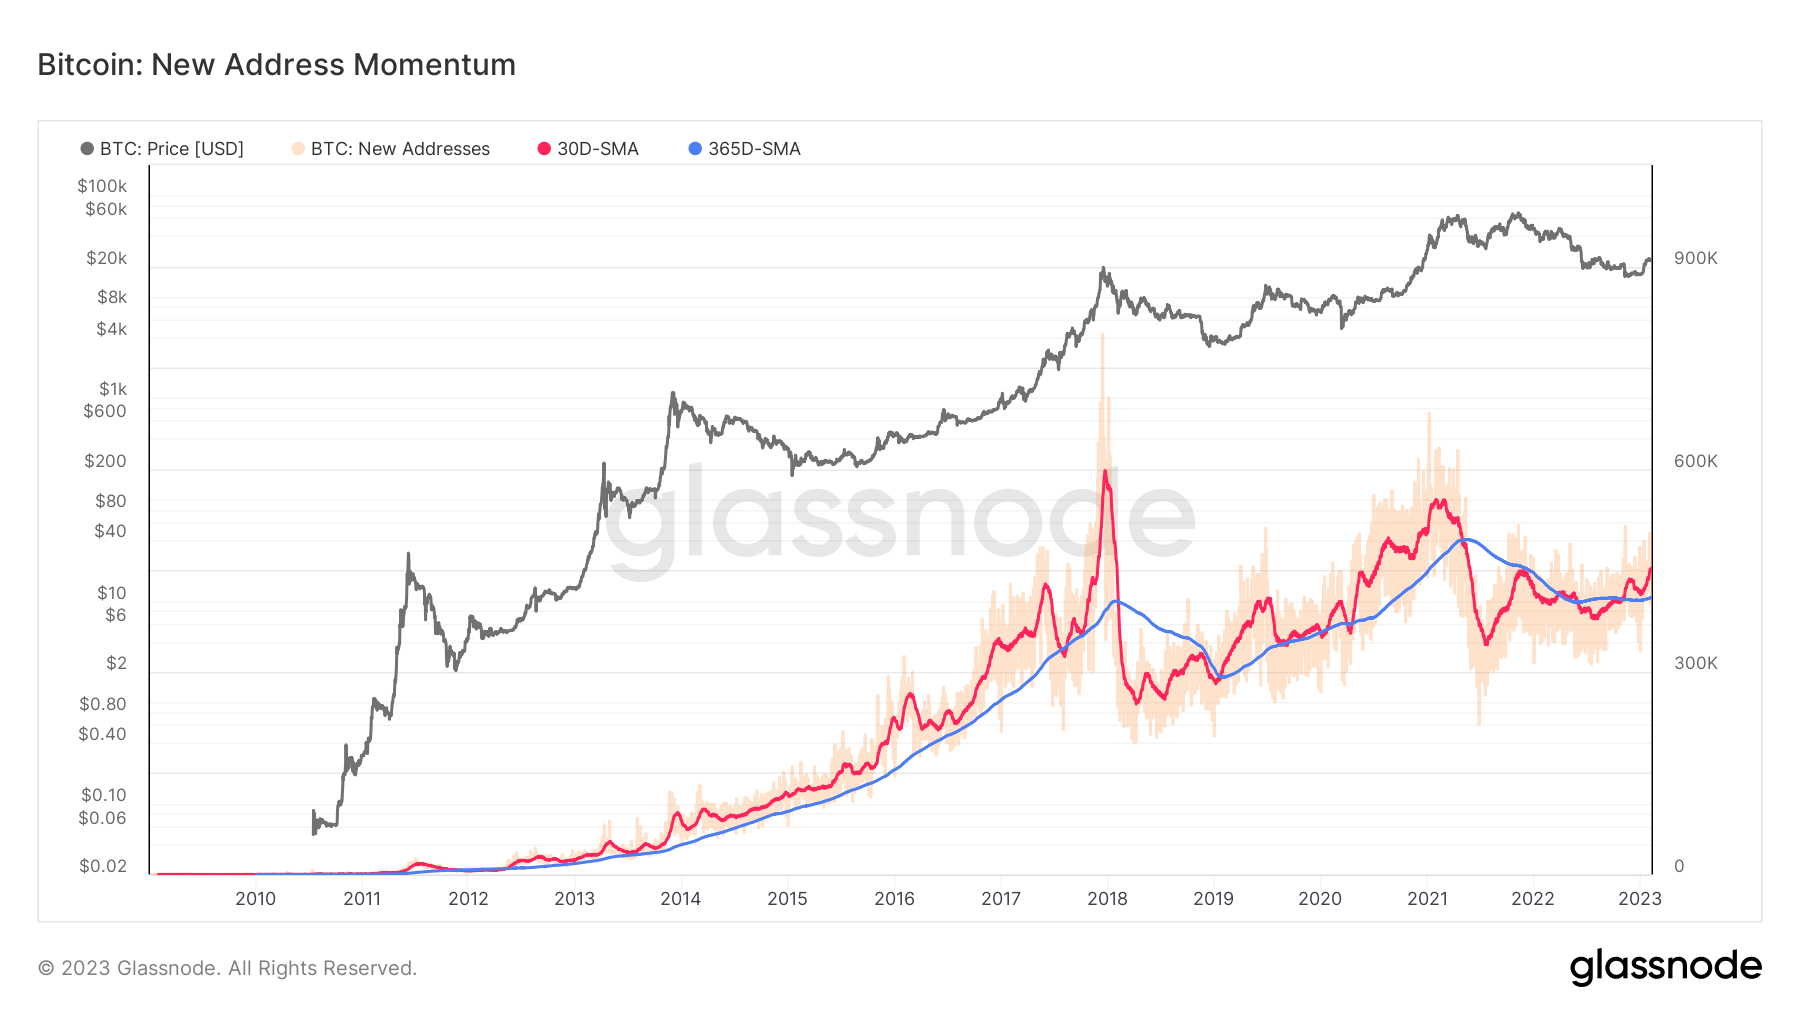
The chart above reflects the number of average monthly and yearly new addresses on the BTC chain, which are represented with the red and blue lines, respectively.
New entity momentum
This metric represents the new entities that come to a blockchain and can provide meaningful insights when used together with the new address momentum metric.
Similar to the new address momentum chart, the chart below represents the average monthly and yearly BTC new entity momentums since 2010. The pink line represents the monthly average, while the green one reflects the annual average.
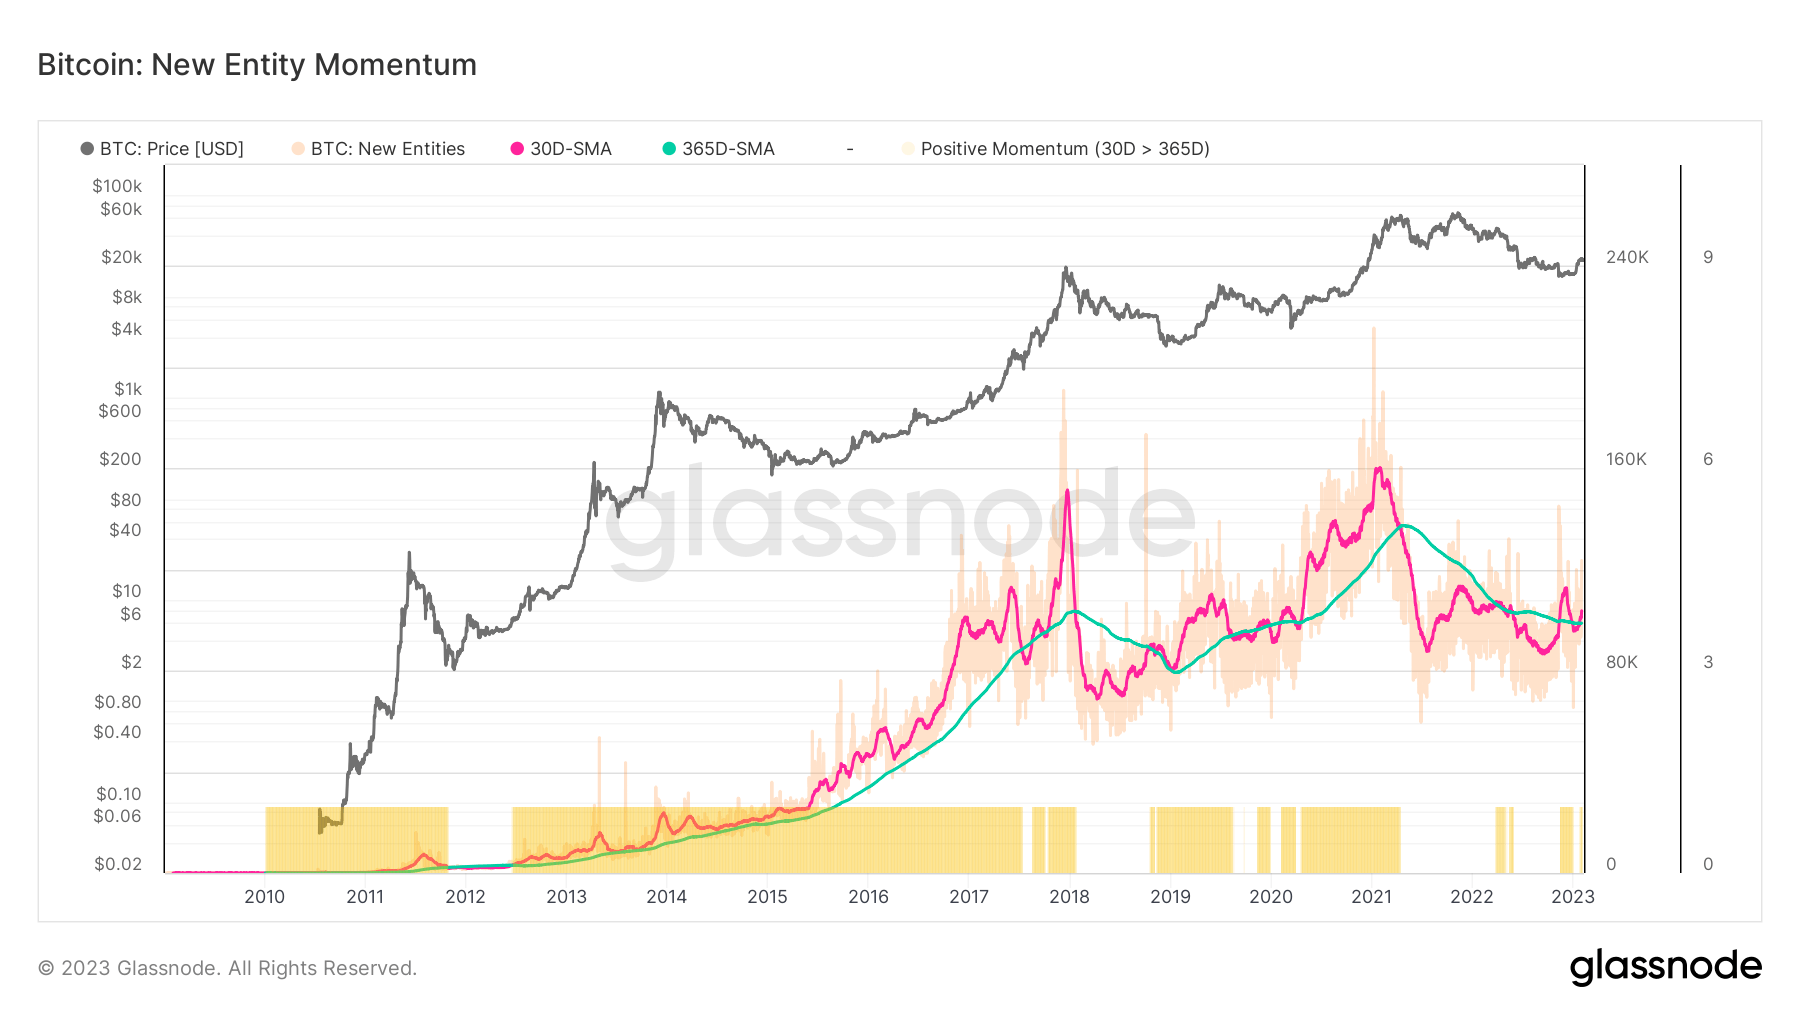
Both metrics underline relative shifts in dominant sentiment and help identify when the tides are turning for network activity. When the monthly average surpasses the yearly one, it indicates an expansion in on-chain activity, usually reflecting fundamental network improvements and growing network utilization.
If the yearly average exceeds the monthly average, it indicates a contraction in on-chain activity, a typical sign of deteriorating network fundamentals and declining network utilization.
The charts indicate that currently, both BTC's new address momentum and new entity momentum metrics are above the yearly averages. Historical data suggests that a bull market sentiment emerged each time these metrics exceeded the annual average. The latest example of this can be observed during the first month of 2023, which saw BTC increase from around $15,000 to $24,000.
This also supports the arguments claiming that the bull run in 2021 ended in mid-2021, and the November bull run wasn't organic and was pushed by derivatives.
Currently, we see new entities come into the BTC network in an effective manner for the first time in 2021. However, the flow stopped for a brief period during early 2022, but it can be said that this period was during the end of the bull run.
Ethereum
The metrics for ETH reflect a different sentiment. The charts below represent the average monthly and yearly active address momentum and new address momentum metrics for ETH.
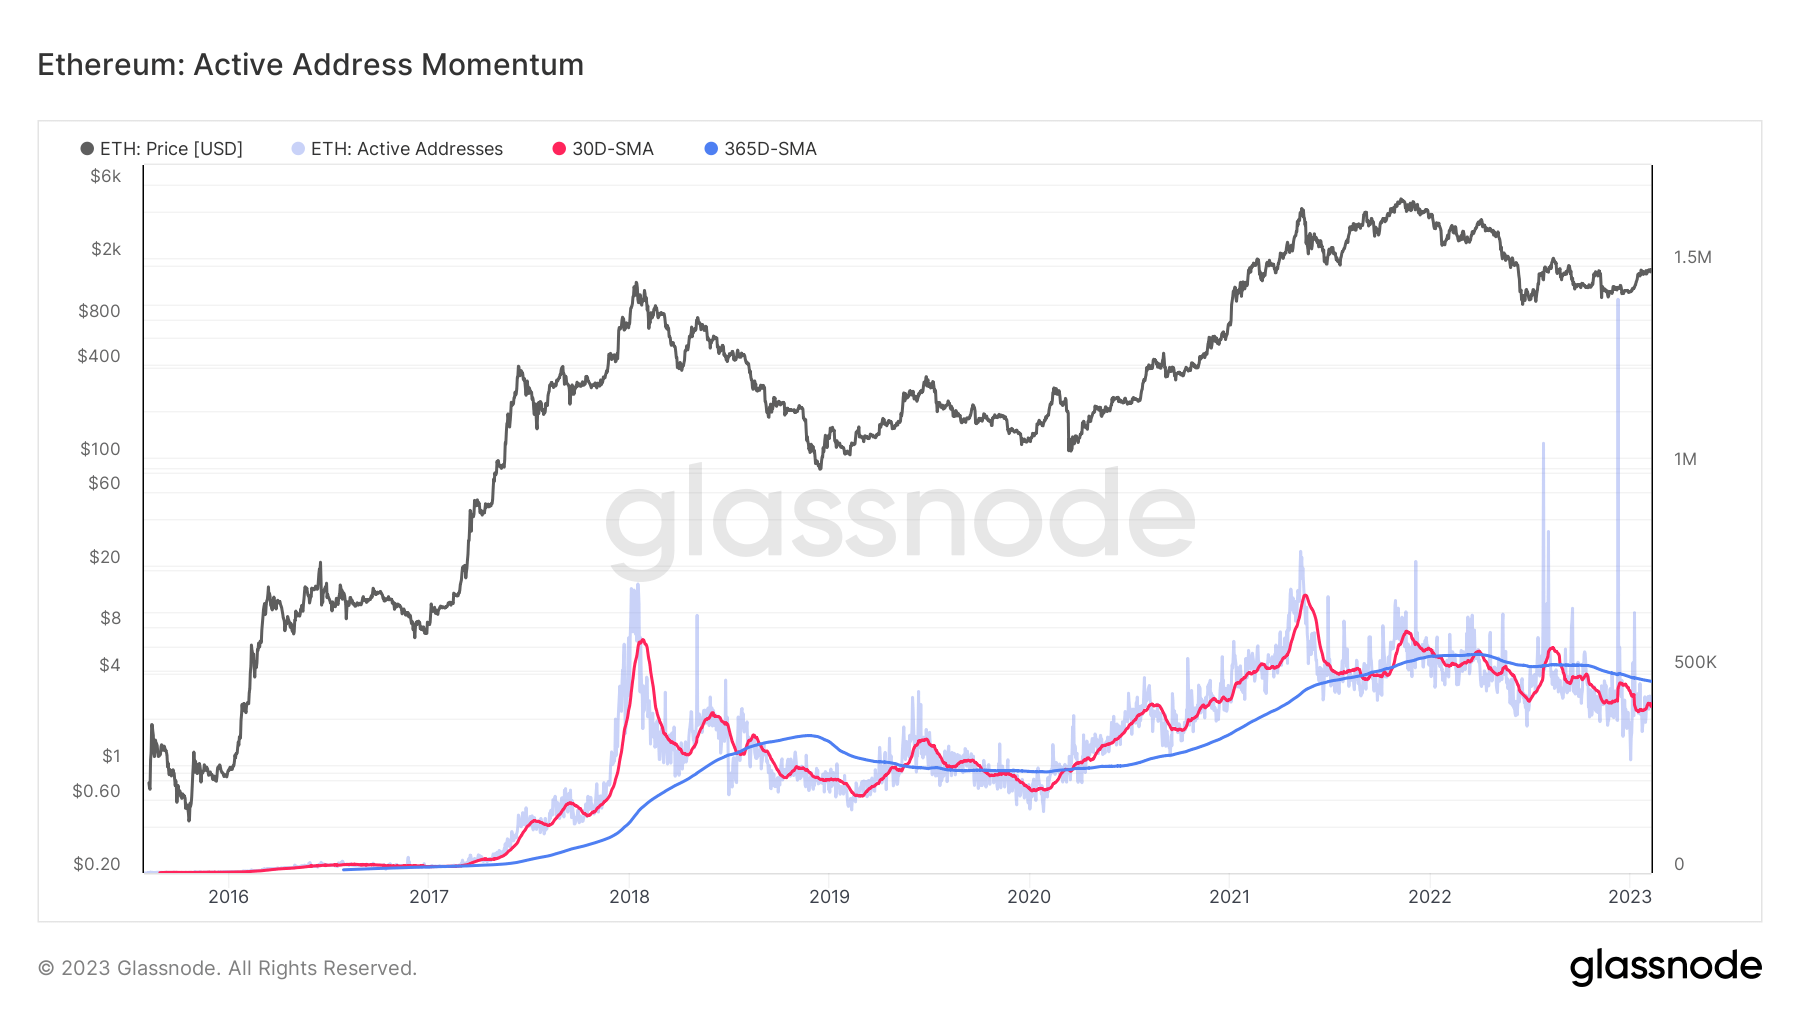
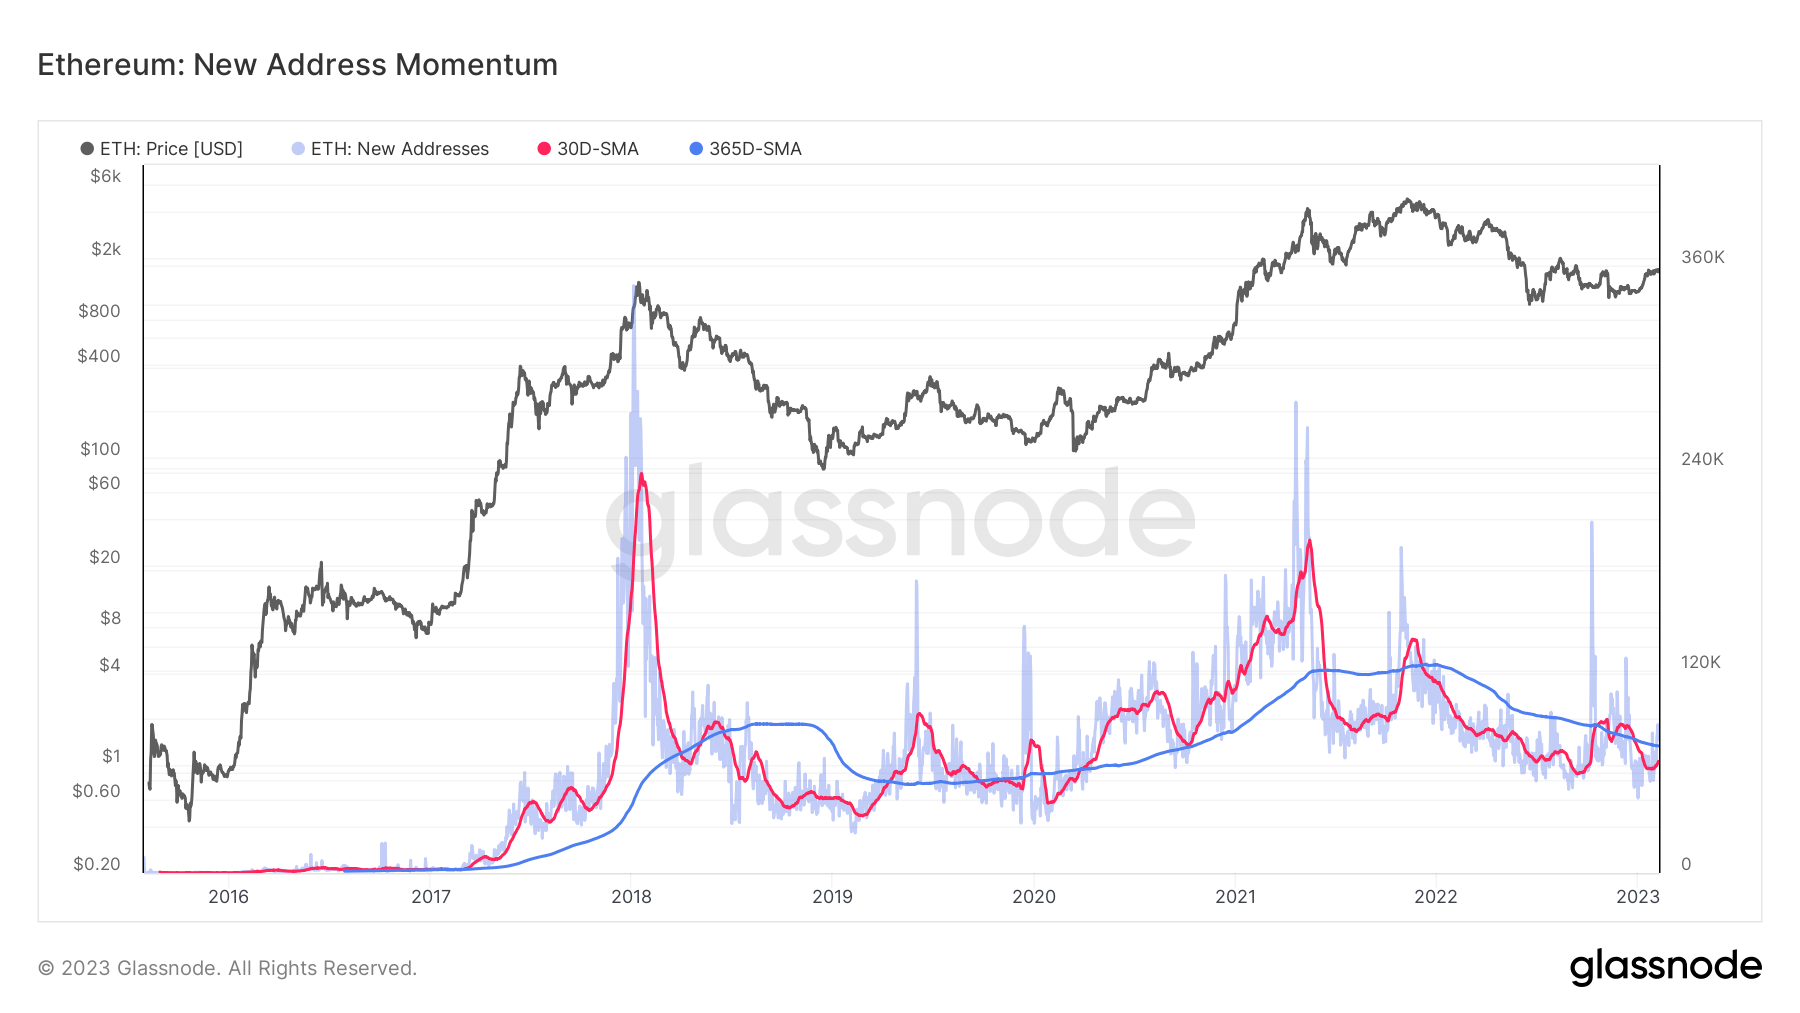
Both metrics are firmly below the yearly average, suggesting a lack of new participants entering the network. These metrics have been below the annual averages since the beginning of 2021.