Renowned analysts present the bullish and bearish case for Bitcoin

Cover art/illustration via CryptoSlate. Image includes combined content which may include the use of AI tools.
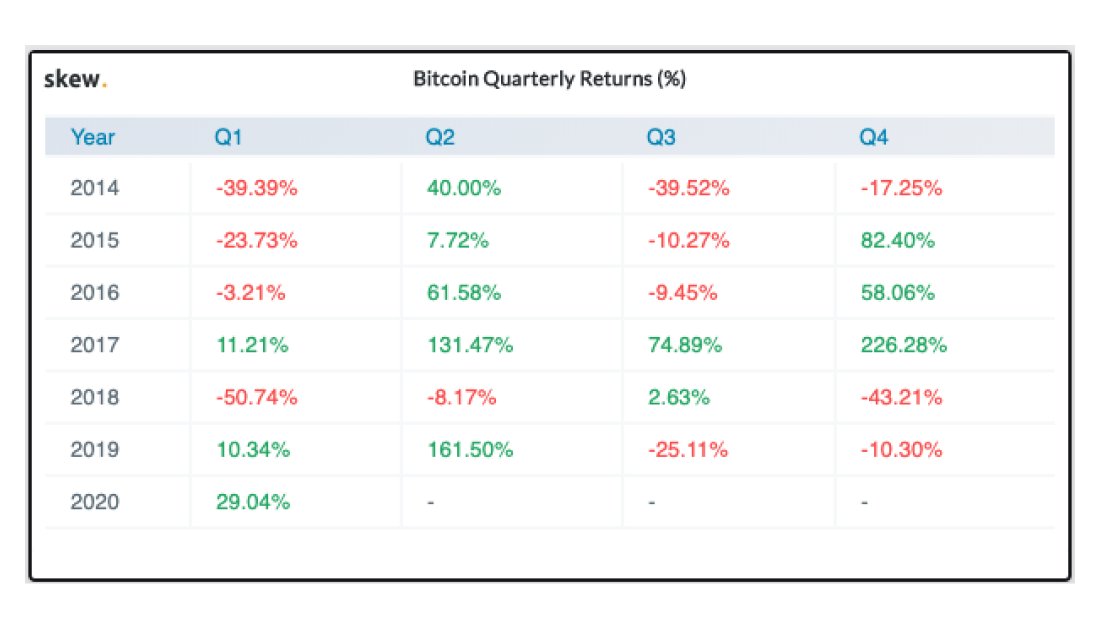
Bitcoin has seen its price surge by nearly 40 percent since Jan. 3. The bullish impulse allowed the flagship cryptocurrency to move far beyond the $9,000 resistance level. As a result, BTC has today a year-to-date (YTD) return of 170 percent making Q1 2020 the best performing Q1 in the last seven years, according to Skew.
The exponential price increase seen over the last month suggests that Bitcoin could be about to find an exhaustion point before continuing its bullish trend. However, it is not precise when a retracement will take place.
The following technical analysis evaluates the views of some of the most prominent chartists in the crypto community about what price point could trigger a correction.
Bitcoin is bound for a pull back
In a recent blog post, Peter Brandt, a 45-years trading veteran, said that Bitcoin could be in “the early stages of another parabolic movement.” The analyst believes that the low of $6,477 that BTC made on Dec. 18, 2019, in combination with the low of $3,225 on Dec. 14, 2018, could be ”redefining into the parabolic advance that could be in the process of developing now.”
Brandt was hesitant to make any price predictions, but mentioned that Bitcoin could go higher than $100,000 by next year. Despite the bullish outlook, the trading veteran argued that the pioneer cryptocurrency is about to reach an exhaustion point.
Brandt said:
“If you take this channel that we had coming from [June 2019 down to Dec. 2019], there is a tendency when you draw a parallel line equal to the distance of the height of this channel. And, that is going to be where we are going to start running into significant resistance in the next couple of days and that comes in just under $10,400.”
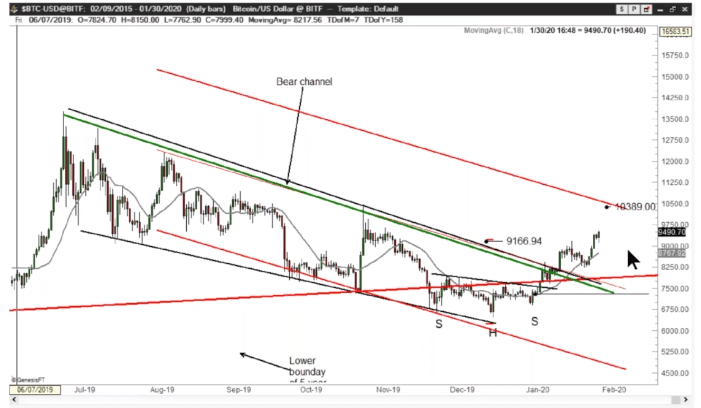
Along the same lines, Tone Vays, a former Wall Street trader and vice president of JP Morgan Chase, said that there is significant resistance between $9,700 and $10,000. A spike in the selling pressure behind Bitcoin around this price level could trigger a retracement down to the 200-day moving average. This support level sits around $8,900 and could present a potential buying opportunity, according to Vays.
Vays added that if the flagship cryptocurrency breaks below its 200-day moving average, then it could be bound for a further decline. Closing below this support level could take Bitcoin down to $7,800 or $7,300.

Such a downward movement may form the right shoulder of a potential head-and-shoulders pattern that appears to be developing on BTC’s 1-day chart. Then, BTC could bounce off this area to try to break above the neckline.
The head-and-shoulders pattern projects a 33.50 percent target to the upside upon the breakout point. If validated, Bitcoin could rise to a new yearly high of $13,000.
This target is determined by measuring the height from the neckline to the head of the bullish formation.
The bulls could remain in control
Although Bitcoin appears to have entered overbought territories, Big Chonis, a stock and cryptocurrency trader with over 10 years of experience, maintains that “the weekly chart paints a different picture.” He argues that a weekly close above $9,500 would be “very bullish” for the pioneer cryptocurrency.
Closing above this significant price hurdle could set the stage for a further advance. The next level of resistance is given by the 50 percent Fibonacci retracement level, according to Chonis. This barrier sits at $11,520.

As the weekly candlestick close approaches, it remains to be seen whether the bulls or the bears will take control over the price of Bitcoin in the upcoming week.