Oil finally loses its grip on Bitcoin – but now liquidity takes over the sell pressure
Brent below $80 removed one pressure point, but BTC still needs rates, ETF flows, and risk appetite to turn.

Quick Take
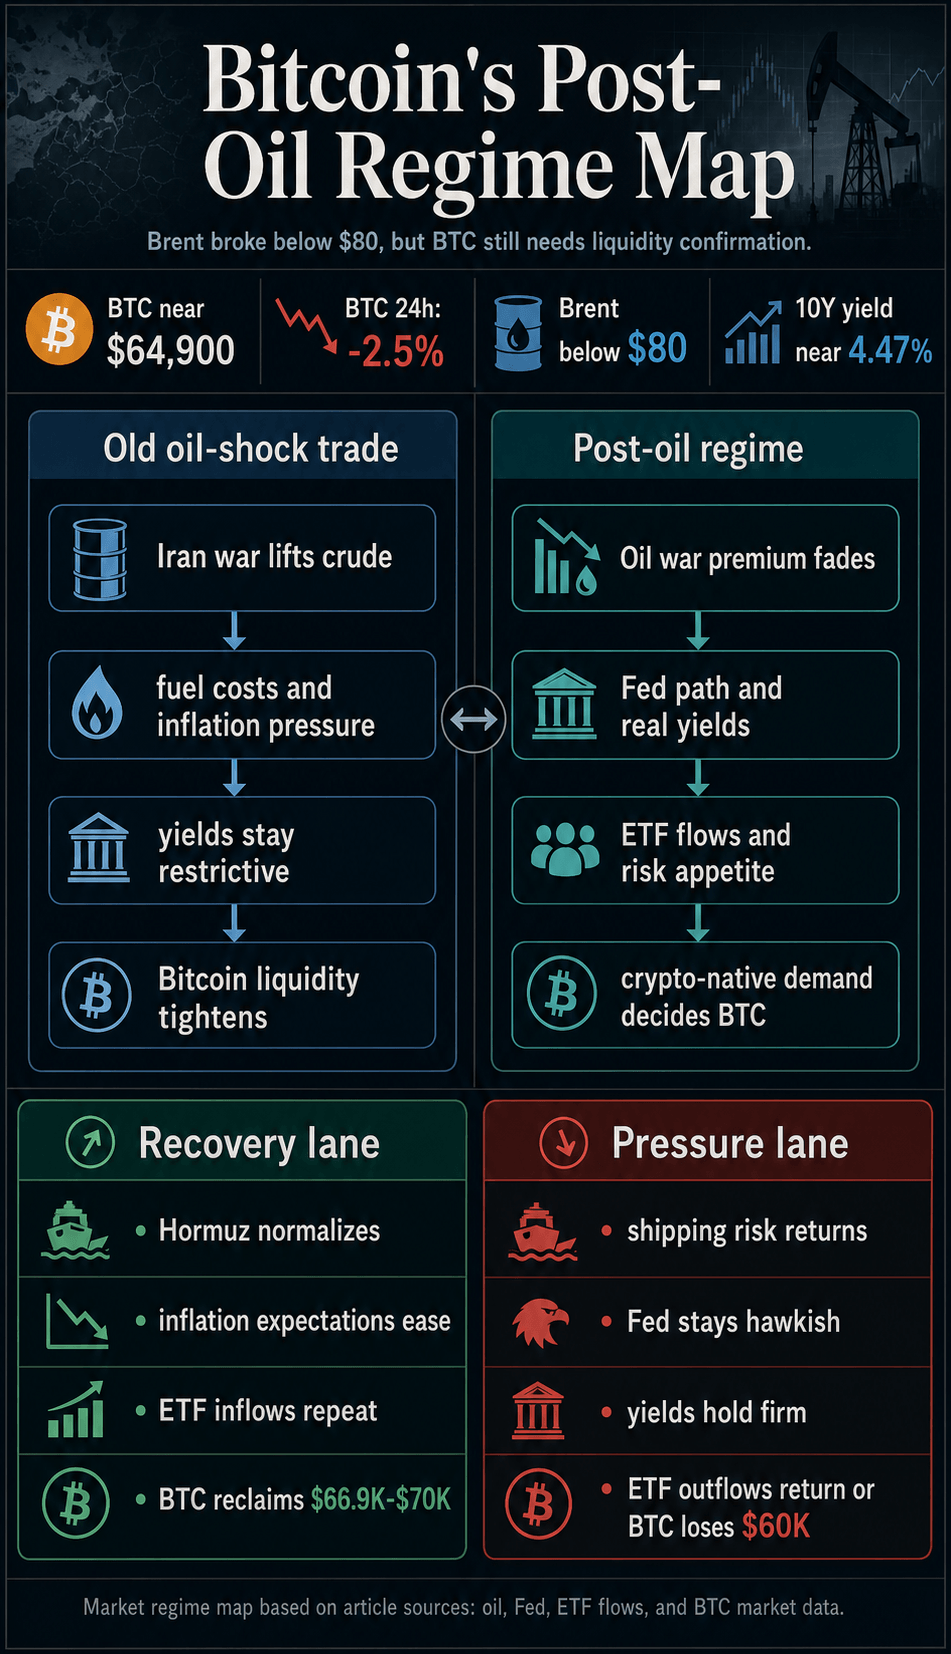
- Brent crude fell below $80 after the US-Iran framework, while Bitcoin held near $64,900 and slipped about 2.5% in 24 hours.
- Lower oil removes one bearish pressure on BTC, but rates, ETF flows, and risk appetite still need to improve for a rebound.
- Hormuz traffic is still unresolved, and a hawkish Fed, firm yields, or ETF outflows could keep Bitcoin pinned lower.
Bitcoin is falling while Brent crude trades below $80 after the US-Iran peace framework.
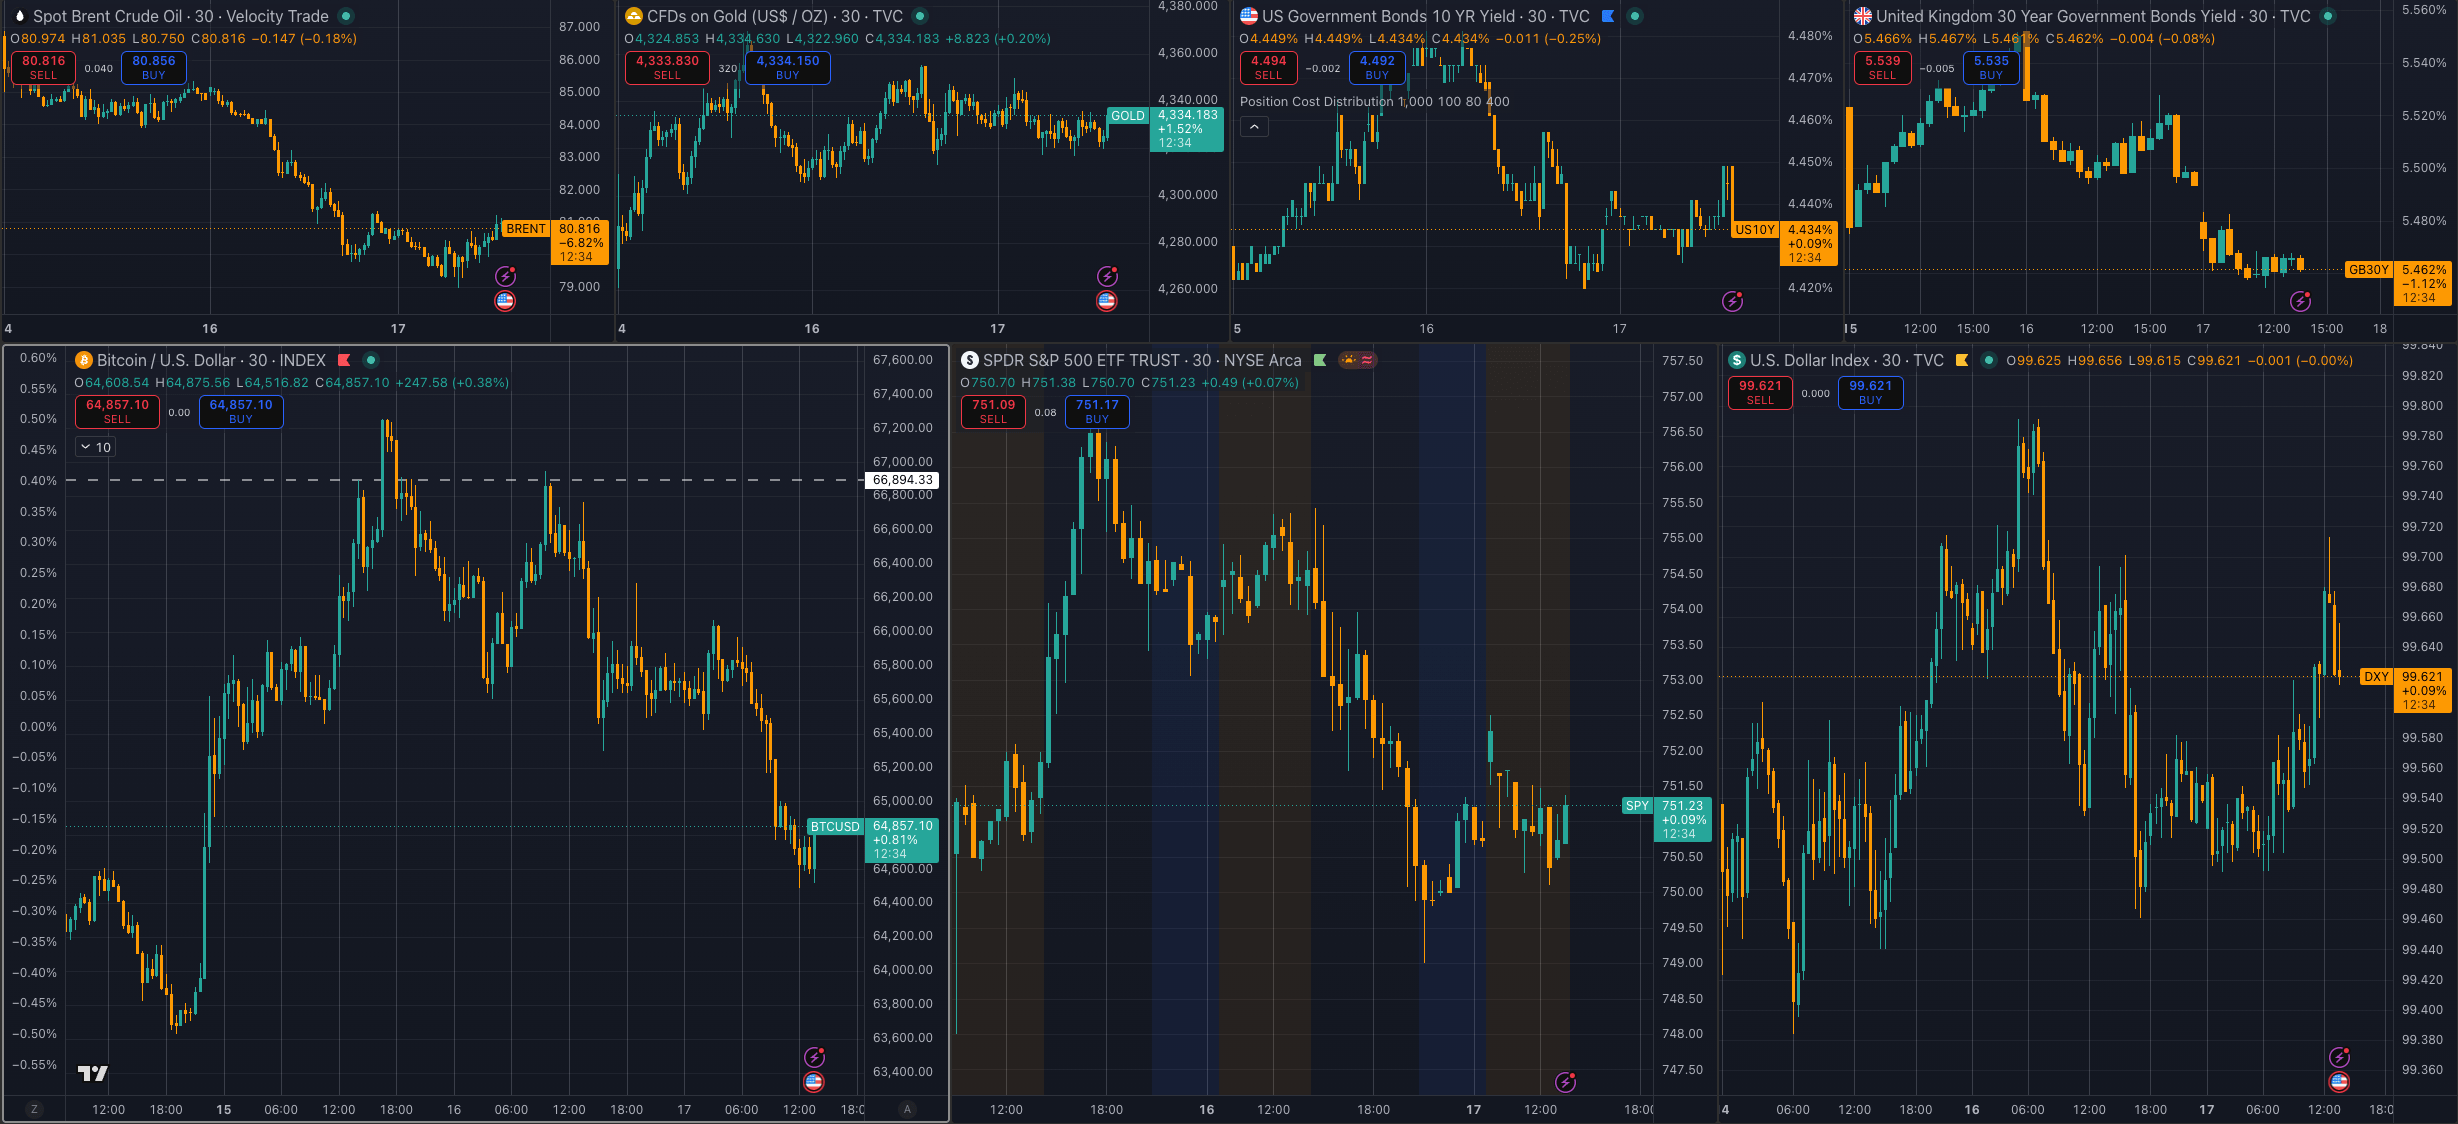
The oil shock that dominated Bitcoin's 2026 macro trade has eased, yet BTC is still trading near $64,900, down roughly 2.5% over 24 hours on CryptoSlate's Bitcoin price page.
Brent's drop should have given risk assets a cleaner relief trade. Instead, it has exposed the next problem.
The market has moved past the simple oil-up, Bitcoin-down model. Lower crude removes a bearish driver. Restored liquidity support will still have to come from rates, ETF flows, and risk appetite through the end of 2026.
Global oil prices settled below $80 for the first time since the Iran war began, after the US-Iran framework pointed toward reopening the Strait of Hormuz. Ships were still not moving normally through the chokepoint, leaving the peace deal's operational effect unresolved.
President Donald Trump's public message that the Iran deal was complete gave traders the catalyst to remove part of the war premium from crude. Bitcoin's response puts liquidity, rates, risk appetite, ETF demand, and crypto buyers' willingness to step in after the geopolitical pressure at the center of the next trade.

Oil Moves To The Background
The old Bitcoin trade was coherent. When the Iran war lifted crude prices, it threatened to push fuel costs through supply chains, keep inflation expectations elevated, delay Fed rate cuts, and leave risk assets with less oxygen.
That earlier oil-pressure setup was already evident when Bitcoin fell, as higher oil prices, higher yields, and the vanishing of rate-cut expectations tightened financial conditions. Oil became the first signal because it was the fastest way for the war to reach inflation, yields, and the Federal Reserve.
The Iran-deal rally framework made the same point from the other side. A peace framework could help Bitcoin only if lower crude oil prices translated into real oil flows, lower gasoline prices, softer inflation compensation, and a Fed path that looked less hostile to risk assets.
The first link in the confirmation chain has now moved. Crude has broken lower, and Bitcoin is failing to trade like an asset with a clear path back to upside.
Oil has shifted from main driver to background risk. If Hormuz traffic fails to normalize, or if energy markets reprice disruption, oil can still hurt Bitcoin. If crude keeps falling without a matching improvement in Fed expectations, ETF flows, and risk appetite, Bitcoin has less reason to rally.
The Fed remains central. The April FOMC minutes kept energy-driven inflation risk in view, and the 10-year Treasury yield was around 4.47% in the latest visible data.
That is a restrictive backdrop for a non-yielding asset that still trades like high-beta liquidity in stress periods.
The next Fed communication sits directly in that path. Bitcoin needs the market to believe lower oil will give policymakers room to stop leaning against risk.
A hawkish Fed message, sticky inflation language, or another push higher in real yields would leave the peace deal looking like a crude-market event rather than a Bitcoin liquidity event.
That is why the lower oil print places a different burden of proof on Bitcoin. The next confirmation has to come from the parts of the market that set liquidity: Fed communication, Treasury yields, dollar pressure, equity-risk appetite, ETF flows, and derivative positioning.

Liquidity Becomes The Year-End Test
Bitcoin ETF flow data showed a small positive daily flow on June 16, but the magnitude is too small to account for the entire regime shift.
Earlier ETF-flow coverage showed how quickly institutional demand can turn from support into a stress point when oil, rates, and risk appetite move against Bitcoin.
That is why the year-end path depends less on one green ETF print than on repetition. Bitcoin needs several sessions in which lower oil is joined by steady ETF demand, softer yields, and a broader risk appetite.
Without that combination, the market may interpret the latest inflow as a pause in de-risking before any new allocation cycle begins.

Crypto-native liquidity is the final test. BTC open interest and futures volume were large enough to make positioning relevant for short-term price transmission, according to CoinGlass data.
Direction still depends on the catalyst. Any surprise from the Fed, ETF desk, or equity market can travel quickly through leveraged positioning.
| Signal | Oil-shock regime | Post-oil regime |
|---|---|---|
| First market question | Will crude keep inflation and yields high? | Will lower crude reach Fed expectations and risk appetite? |
| Bitcoin pressure point | Higher energy costs tightened financial conditions. | Weak liquidity and uneven ETF demand limit recovery. |
| Confirmation signal | Hormuz flows, gasoline, CPI, and Fed pricing. | ETF inflow streaks, softer yields, weaker dollar pressure, and risk-on equities. |
| Failure signal | Renewed crude stress and no rate-cut path. | BTC loses $60,000, yields rise, or ETF outflows return. |
The base case into year-end is a fragile, liquidity-led recovery attempt.
That is a more cautious view than the oil chart alone would suggest. Brent below $80 removes one of the biggest bearish inputs for 2026, but Bitcoin still has to rebuild the demand side.
The asset can recover if lower crude becomes lower inflation expectations, if yields drift lower, and if ETF flows shift from one-off positive days to steady demand.
The recovery lane is straightforward. Hormuz traffic normalizes, gasoline pressure eases, inflation compensation falls, and the Fed gets enough cover to sound less restrictive.
At the same time, Bitcoin ETF flows stabilize, spot demand improves, and BTC reclaims the $66,900 to $70,000 shelf that recent market-structure coverage highlighted as important.
In that lane, oil's job is to prevent the liquidity trade from being blocked. The upside would come from capital returning to Bitcoin as a scarce, liquid risk asset once rates and flows stop arguing against it.
The pressure lane is just as clear. The peace framework can stall at implementation, tanker traffic can remain impaired, or crude can reprice if shippers and insurers lose confidence in the route.
Even with lower oil, Bitcoin can remain pinned if the Fed removes easing hopes, if Treasury yields hold firm, or if ETF flows return to redemptions.
That is the key shift. Liquidity and risk appetite now carry the trade. Bitcoin's next move depends on whether the market sees the peace deal as a real disinflation shock or as a crude reset that leaves rates, dollar pressure, and ETF demand unresolved.
For the rest of 2026, liquidity and risk appetite have outpaced oil. Bitcoin's bullish case is still alive, but it now runs through the Fed, ETF desks, and the willingness of crypto capital to buy the dip after the war premium has already come out of crude.
Bitcoin is -2.93% over the past 24 hours and currently sits at rank #1 by market cap.
More Bitcoin market context Supply, launch date, volume flow, and price-cycle context.
Where the broader market sits right now
Right now, the total crypto market is valued at $2.16T with $70.18B in 24-hour volume. Bitcoin dominance sits at 58.54%. Explore the market