Ethereum is breaking out following bitcoin’s bullish momentum

Cover art/illustration via CryptoSlate. Image includes combined content which may include the use of AI tools.
Bitcoin recently hit new highs of $7,000 and altcoins are beginning to follow after several days of depreciation. One of those coins, ethereum, has managed to surge 16 percent over the last 24-hours. Is there more bullish momentum to come?
$BTC money will flow into $ALTS it's just a matter of time.
I'm honestly surprised how long we've had so far…
— The Crypto Dog? (@TheCryptoDog) May 11, 2019
Ethereum technical analysis
On the 1-day chart, multiple technical patterns are forming which could predict an upcoming major breakout.
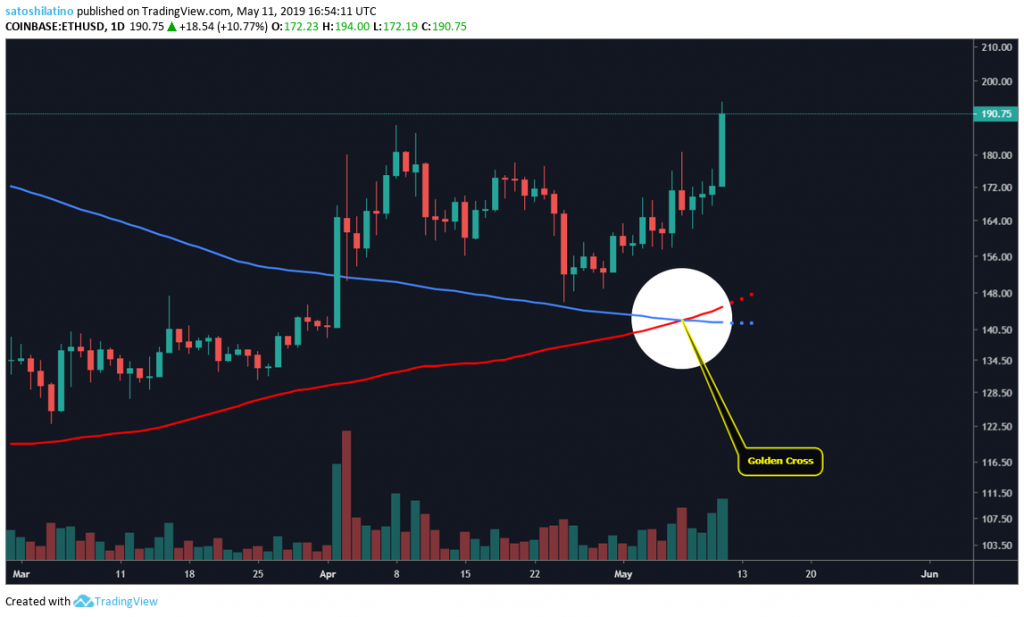
On May 7, 2019, ethereum had a golden cross formed on the 1-day chart when the 100-day moving average crossed above the 200-day moving average. According to Investopedia, this pattern is seen by many traders as the most definitive and strong buy signals that could start a long-term bull market.
The last time this bullish breakout pattern developed on ETH’s 1-day chart was on Mar. 13, 2017, and it was followed by a 5,800 percent upward move that lasted almost a year.
A support level is a price point where the market valuation is more likely to bounce off as it falls while a resistance level is a price point where the price tends to be rejected as it rises. These levels can be predetermined by multiple touches of the same price based on historical data.
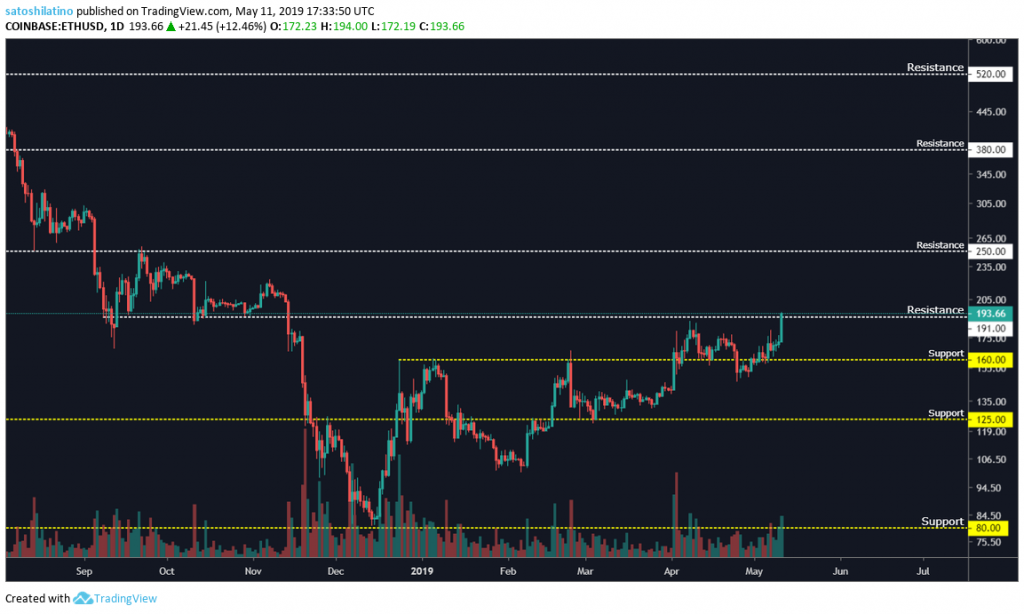
On ether’s 1-day chart, it seems there is an important resistance level around $191, which is the price range the cryptocurrency is trading at the moment. If this level is broken to the upside, ETH could rise to the next resistance points which are $250, $380 and $520. Once a resistance level is broken, it becomes a support point and the same happens in the opposite direction.
If ethereum is not able to break above the current resistance level, it could fall back down to the closest support level which sits at $160. The next major level of support is at $125.
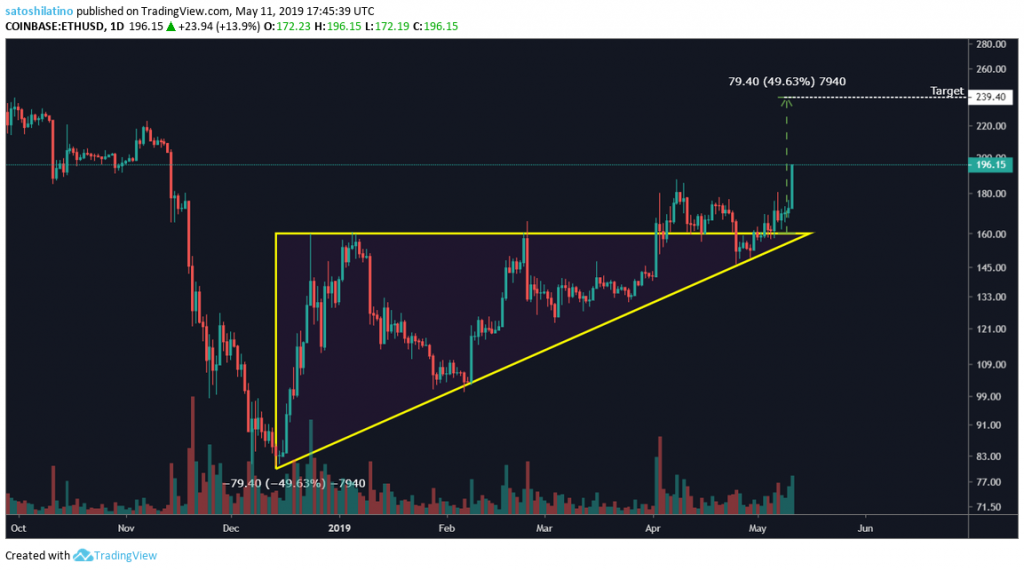
An ascending triangle has formed on ETH’s 1-day chart. This chart pattern is defined by Investopedia as a continuation pattern that is confirmed once the price breaks above the top of the triangle. A target can be calculated by measuring the height of the triangle, which can be added to the breakout price.
In the case of Ethereum, it seemed to have broken out of the triangle early in April, but later it pulled back to the $160 support level and now it seems to be breaking out once again.
Based on the 1-day chart, it seems like all the conditions are given for ethereum to break out. Now, it may just be a matter of time before it does. The support levels previously mentioned could be used as stop-loss points while the resistance levels could be used to take profits.