Research: Bitcoin realized cap vs. market cap reveals shift in safety flight dynamics
Trends in Bitcoin dominance measured in both realized and market caps show users now prefer stablecoins as a safety play.

Cover art/illustration via CryptoSlate. Image includes combined content which may include the use of AI tools.
An analysis of market cap and realized cap Bitcoin dominance (BTC.D) data performed by CryptoSlate suggests that users are increasingly using stablecoins, instead of BTC, as a safety flight.
Most are familiar with market cap, which is calculated by multiplying the circulating supply by the current token price.
Realized cap is also a valuation metric but differs from the market cap by substituting the current token price with the price at the time the token last moved. This method is said to give a more accurate measure of valuation as it considers and minimizes the effect of lost and irretrievable coins.
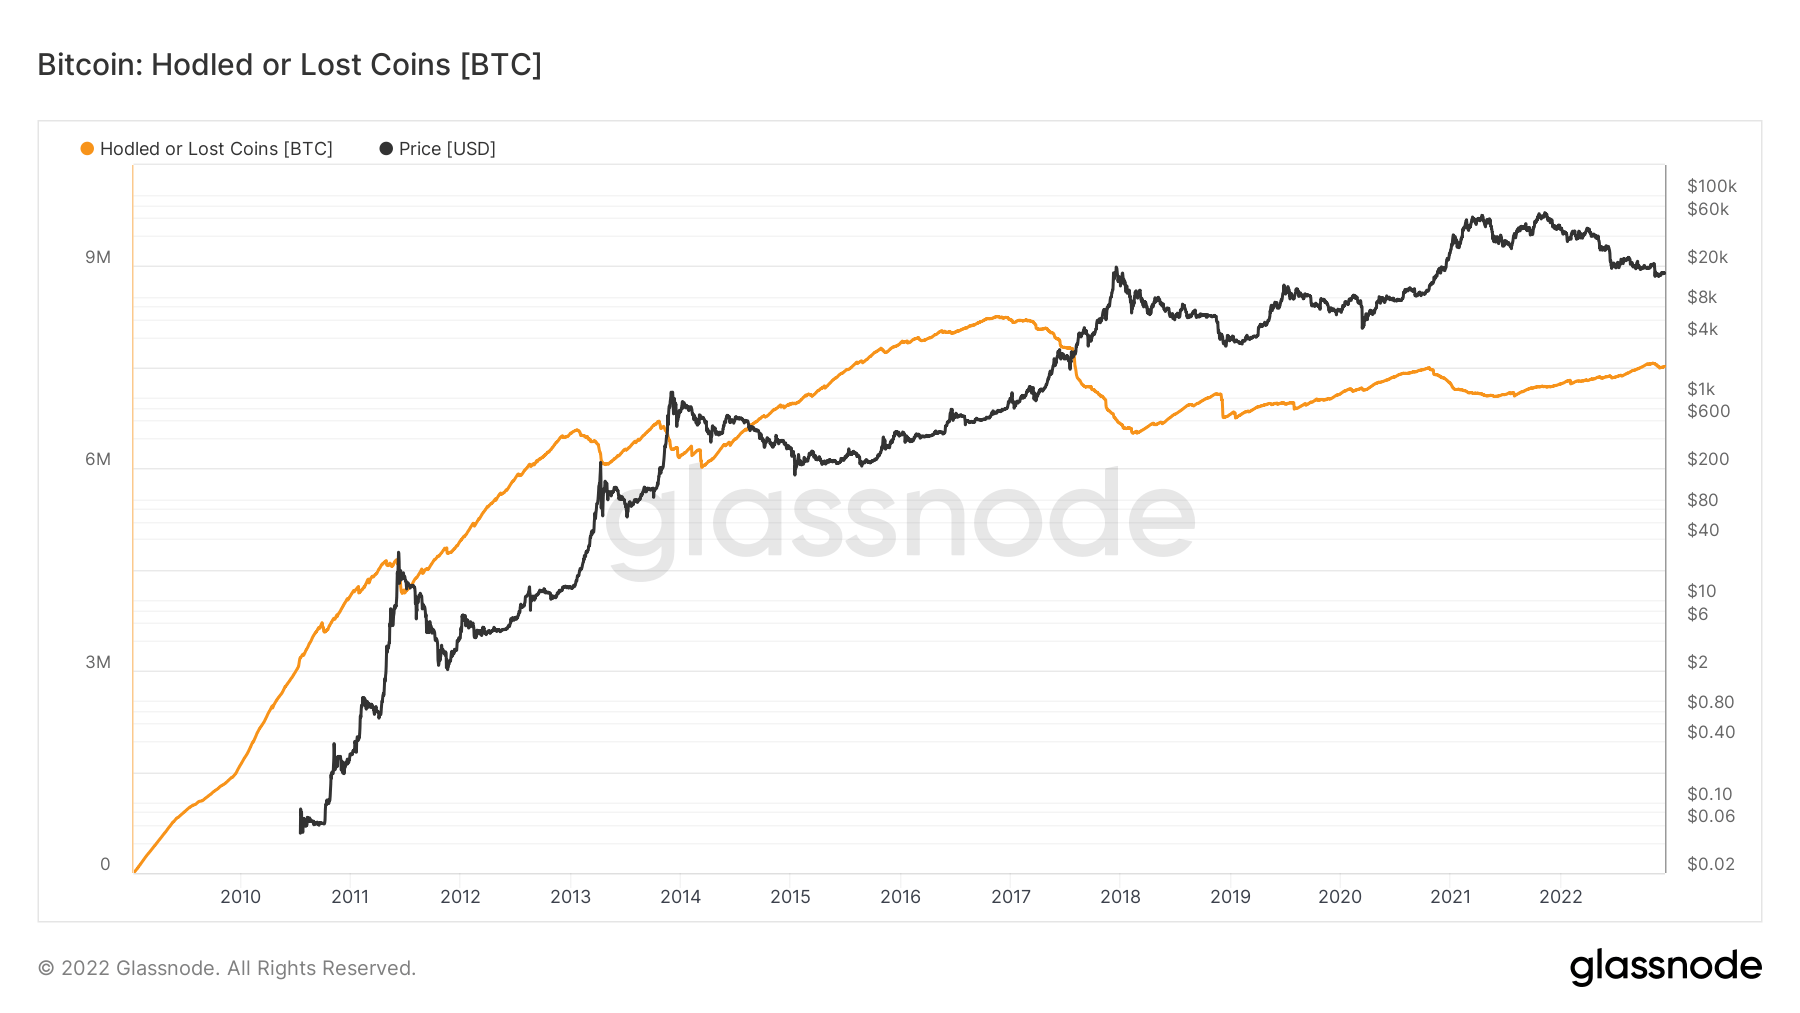
Glassnode estimated hodled or lost coins currently come in at around 7 million tokens, representing a significant proportion of the circulating supply.
If a token has never moved the realized price of that token is zero, and if a token has not moved in a long time its impact is recorded at a much lower price than the current price. Therefore, active tokens make up the bulk of the realized cap valuation, giving a more holistic and representative figure versus market cap.
However, realized cap does not differentiate between tokens that are lost/irretrievable and those that are in deep storage. Therefore, while it does de-emphasize the impact of lost/irretrievable coins, it is still not a perfect valuation measure.
Despite that, market cap is much more widely used than realized cap. For example in the calculation of BTC.D.
Bitcoin market dominance
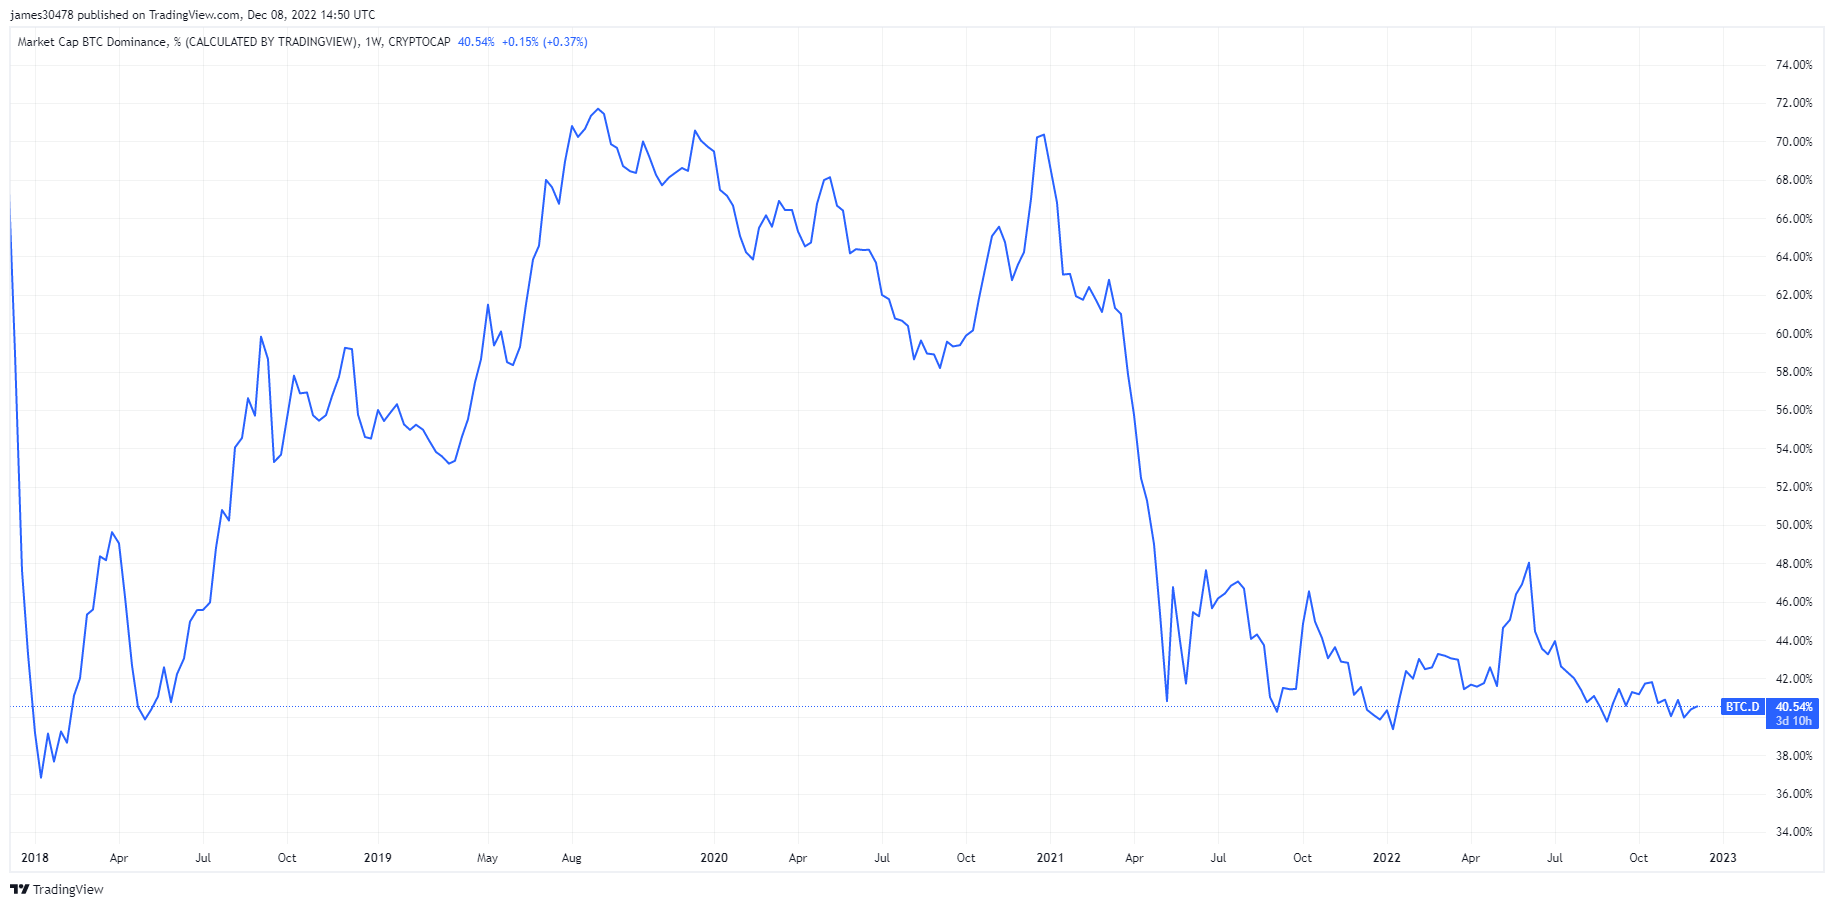
Crypto markets are now over a year since the market top. During this time, BTC.D has been as low as 38.9%, peaking at 48.6% in June following the Terra implosion and subsequent flight to safety.
BTC.D is calculated using the total crypto market cap divided by the Bitcoin market cap. Currently, Bitcoin dominance is at 40.7%, hovering close to cycle lows.
In past bear markets, BTC.D has been much higher, with the previous cycle bear seeing BTC.D hit as high as 73.9%.
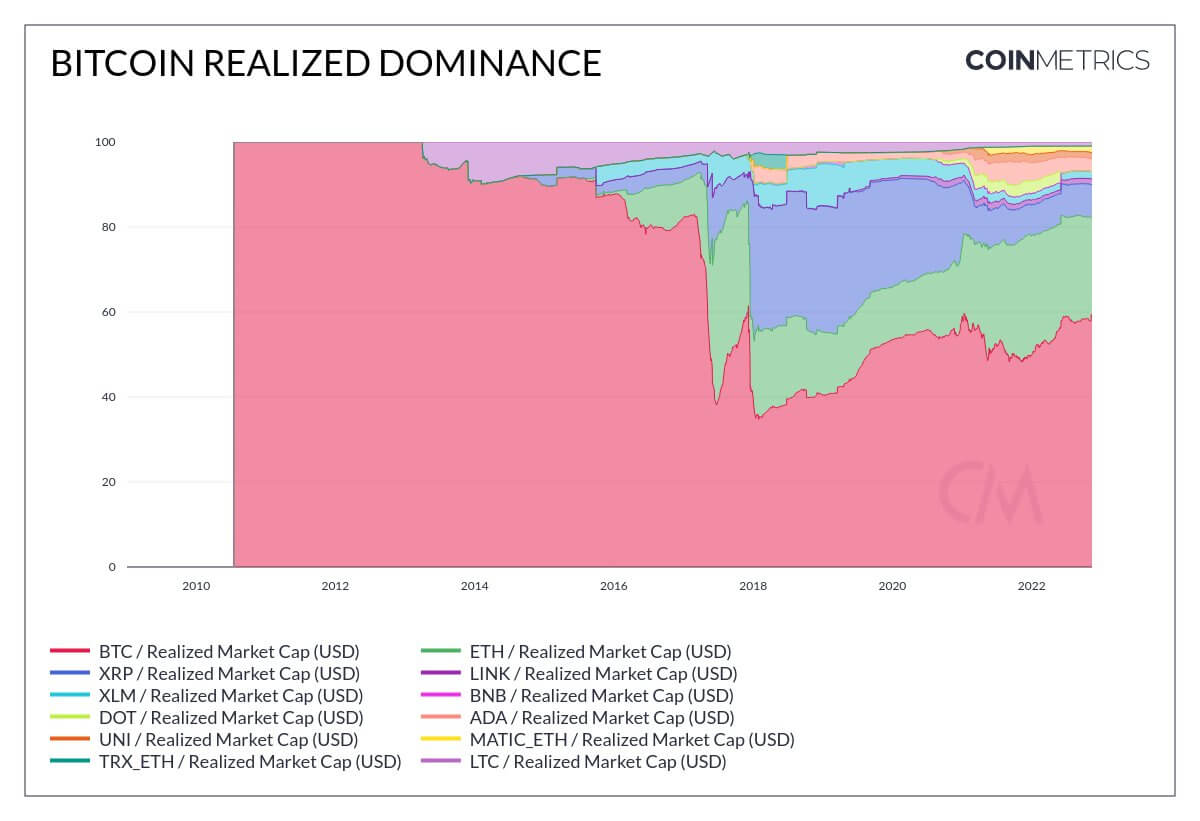
Using realized cap, instead of market cap, to calculate BTC.D gives a current figure of 60%, which is more in line with expectations of the bulk of users cycling into Bitcoin as a safety play during a bear market.
However, like the market cap method for calculating BTC.D, the realized cap method also shows dominance at much higher percentages (than 60%) during past bear markets, such as in 2015, when it was around 90%.
This begs questions about changing market dynamics in 2022 versus 2015.
The rise of stablecoins
Stablecoins are designed to stay at a fixed value regardless of cryptocurrency price volatility. They provide a means to enter and exit positions while retaining capital in the cryptocurrency market.
BitUSD was the first stablecoin to come to market, launching in July 2014. But it wasn't until 2015, when Tether launched, that stablecoins began making their mark. Before Tether became popular, investors tended to cycle into Bitcoin during bear markets. But since around 2017, this has not been the case.
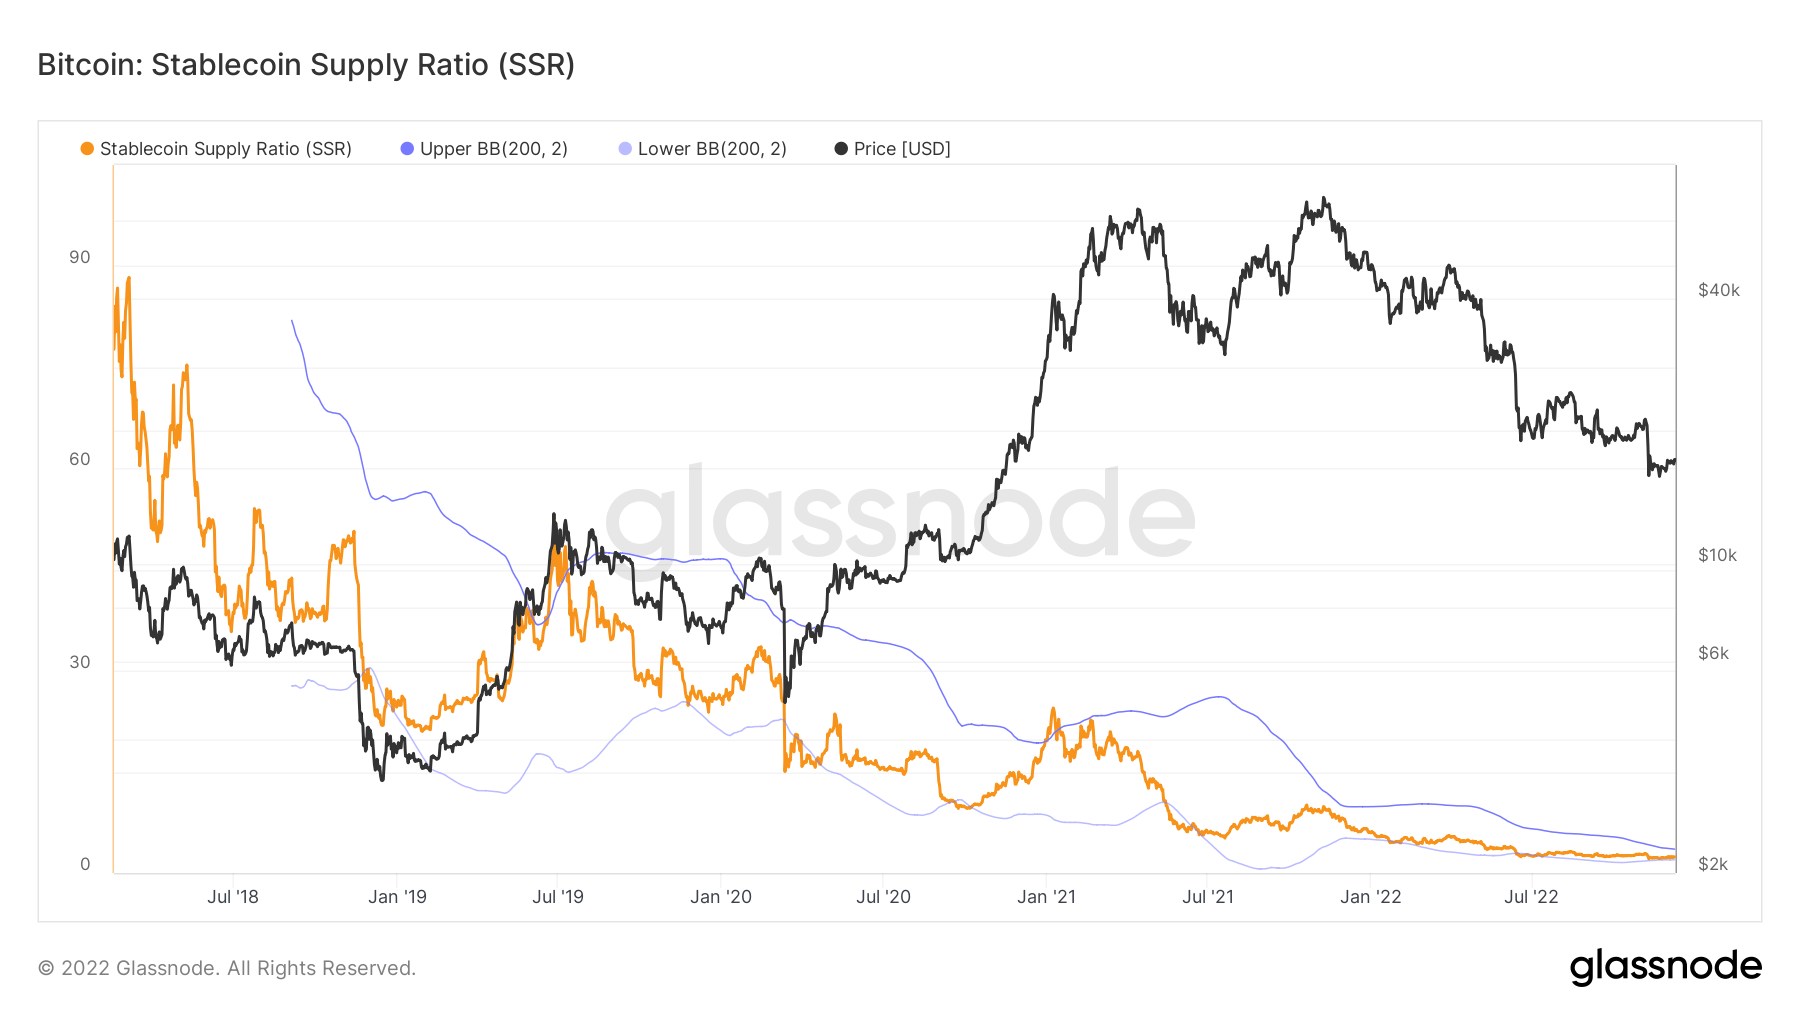
The chart below shows the Bitcoin: Stablecoin Supply Ratio (SSR) on a macro downtrend since 2018, giving a current ratio of approximately 2. This metric illustrates the proportion of Bitcoin supply against stablecoin supply, denominated in BTC.
When SSR is low, this indicates the current stablecoin supply has high buying potential. In other words, a low SSR equates to a high proportion of sidelined stablecoins.
When taken in conjunction with the trend of falling BTC.D, it suggests stablecoins are becoming the go-to choice for safety flight.