This key metric correlates with Bitcoin’s largest price drops
Drops in the total ROI of all daily BTC transactions could be a precursor to major price dips.

Photo by Jeremy Bezanger on Unsplash
At the beginning of the month, Bitcoin dropped to a three-month low of $46,500 in a market-wide flash crash that wiped over 18% of its value in a matter of hours.
According to a report from analytics company Santiment, a spike in an often-overlooked metric preceded both this month's crash and last year's March sell-off and could be used to predict future price swings.
Tracking the ROI of Bitcoin transactions reveals an interesting pattern
Bitcoin's latest crash has left the entire crypto market in shambles, dragging almost every single token deep into the red. The sharp 18% price dip caused a fair amount of short-term panic among sellers and even managed to shake the confidence of long-term holders.
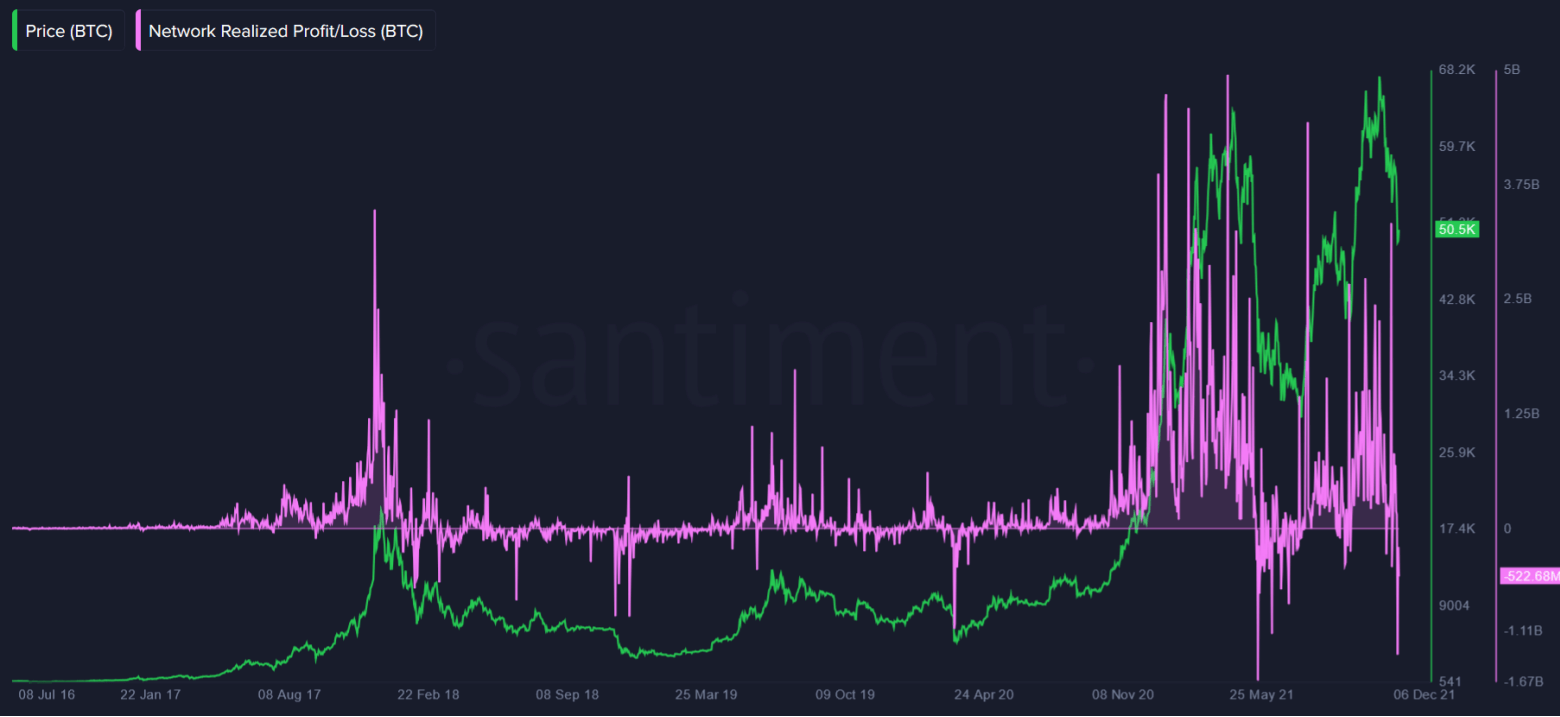
The fear, uncertainty, and doubt were best seen when looking at Bitcoin's Network Realized Profit/Loss (NPL) chart, an often overlooked metric that tracks the total ROI of all daily Bitcoin transactions.
To come up with the indicator, Santiment takes each unit of Bitcoin that moves on the blockchain and assumes its acquisition price was the price at which it last moved. Once the unit changes addresses again, it assumes this to be the selling price.
The difference between the acquisition and sell price shows whether the coins moving on the blockchain are being “sold” at a profit or at a loss.
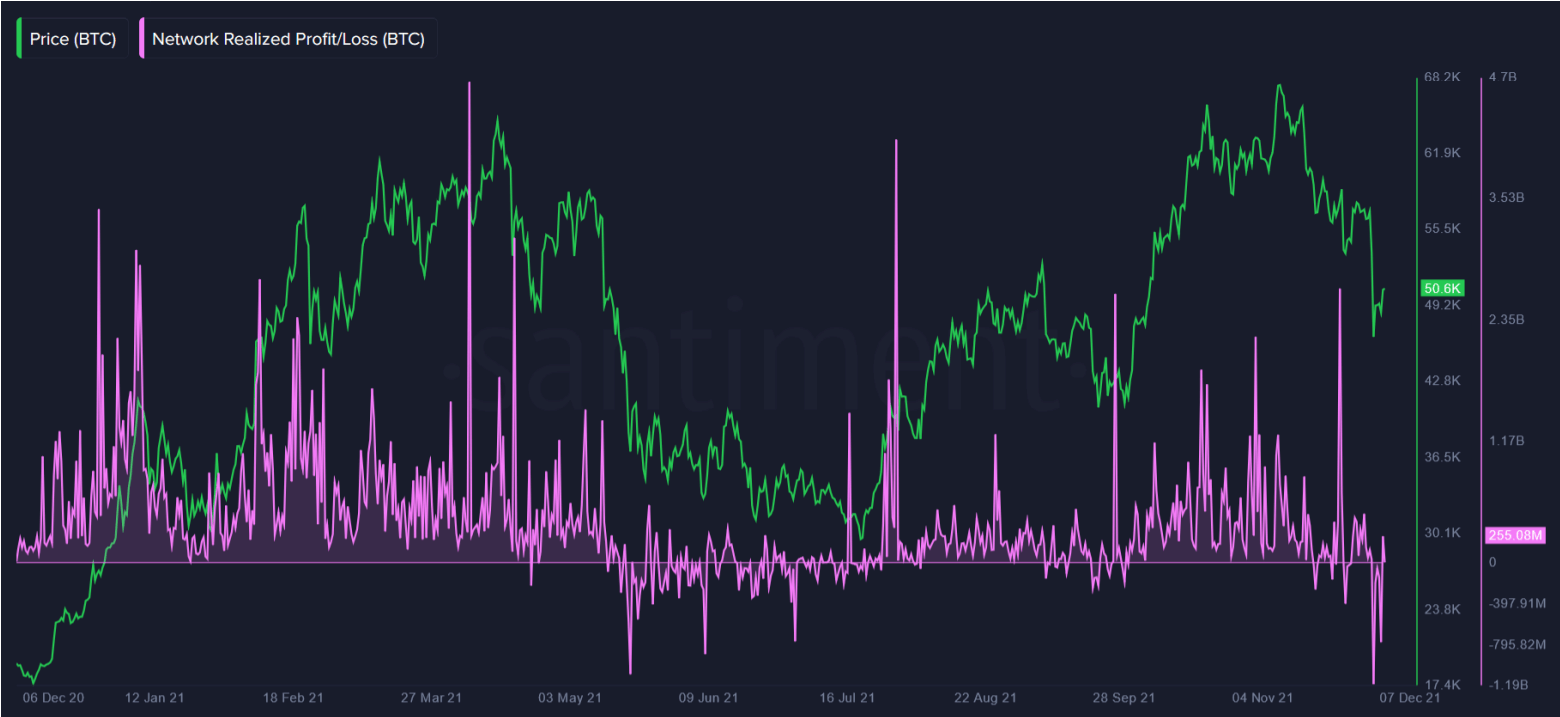
This month's crash triggered one of the largest drops in Bitcoin's NPL and suggested that a significant amount of BTC transferred over the weekend was moved at a loss.
And while a single spike on a chart certainly isn't enough to be considered a good predictor of market sentiment, it's worth noting that a similar dip occurred during Bitcoin's May correction. According to Santiment, at the time, the dip in Bitcoin's NPL pointed to wholesale capitulation and rising panic among “weak hands.”
“On the whole, a significant drop in Bitcoin’s NPL could be indicative of rising FUD among some BTC holders, making moves in expectation of further downtrend,” Santiment said in its report.