The price action of these cryptos is signaling that “altseason” is almost here

Cover art/illustration via CryptoSlate. Image includes combined content which may include the use of AI tools.
A new “altseason” appears to have begun as several altcoins are starting to post significant gains. As a matter of fact, Ethereum Classic is up nearly 300 percent since mid-December 2019 while Cardano and IOTA surged over 90 percent. The following technical analysis evaluates where ETC, ADA, and IOTA could go next.
Ethereum Classic (ETC)
Ethereum Classic entered a massive bull rally that has seen its price increase by 280 percent. This cryptocurrency went from trading at a low of $3.40 on Dec. 18, 2019, to a high of $12.90 on Jan. 29. Such an exponential bullish impulse allowed ETC to outperform the top ten cryptocurrencies by market cap.
Despite the substantial upswing, Ethereum Classic appears to have reached a significant resistance level that could slow down its uptrend. This price hurdle is represented by the 78.6 percent Fibonacci retracement level, which has been able to act as support several times between March and October 2018. Now, it could serve as a strong barrier impeding ETC from a further advance.
Moreover, the TD sequential indicator is presenting a sell signal in the form of a green nine on ETC’s 12-hour chart. This technical index estimates a one to four candlesticks correction or the beginning of a new downward countdown. A red two candlestick trading below a preceding red one candle could be used as confirmation of the bearish signal.

A spike in sell orders around the current price levels could push Ethereum Classic down to the 23.6 percent Fibonacci retracement level that sits at $10.65. Breaking below this support level could trigger a steeper correction taking ETC to test the next levels of support given by the 38.2 and 50 percent Fibonacci retracement levels. These support barriers sit at $9.26 and $8.15, respectively.
Although it seems like Ethereum Classic will not be able to break above $13 easily, an increase in demand could jeopardize the bearish outlook. If ETC is able to close above the recent high of $12.90 with enough volume, it could try to reach a new yearly high. The next level of resistance sits around $15.13.
Cardano (ADA)
The Cardano Foundation recently revealed that 2019 was a “transformational” year for the non-profit organization as well as for the development of its native cryptocurrency ADA. The Foundation’s team expanded across 12 countries pushing the growth of the Cardano community to more than 1.1 million individuals worldwide. Additionally, the firm teamed up with multiple companies to expand the utility of ADA.
These achievements appear to be paying off already as Cardano is up over 90 percent since mid-December. In fact, this cryptocurrency climbed up from a low of $0.030 to a high of $0.057.
The sudden upswing took ADA to hit the 61.8 percent Fibonacci retracement zone, which is currently containing its price from a further advance. This Fibonacci retracement area is considered by many traders as the ‘golden’ retracement zone due to the high probability of a rejection. An increase in the selling pressure behind this crypto could take it to pull back to the 78.6 percent Fibonacci retracement level that sits at $0.044.
Such a retracement could form the right shoulder of a potential head-and-shoulders pattern that seems to be developing on ADA’s 3-day chart. This is a bullish formation that would be validated after the right shoulder is created and Cardano surges above the neckline that sits at $0.56. The head-and-shoulders pattern projects a 45 percent target to the upside upon the breakout point, which could take this crypto to $0.083. This target is determined by measuring the height from the neckline to the head of the bullish formation.
It is worth noting that an increase in sell orders that takes Cardano to close below $0.043 could invalidate the head-and-shoulders pattern. If this happens, ADA could try to test the next level of support around $0.037.
IOTA
IOTA is in a massive downtrend that was triggered after it reached an all-time high of $5.80 in mid-December 2017. Since then, this cryptocurrency continues making a series of lower lows and last month it hit $0.15. This price level has not been seen since the week of July 10, 2017.
Despite the 97.50 percent decline that IOTA has suffered since it peaked in late 2017, demand for this cryptocurrency appears to be rising substantially. As a matter of fact, IOTA skyrocketed over 100 percent since Dec. 18, 2019. The price of this crypto went from hovering at a low of $0.15 to a high of $0.31 on Jan. 29.
Now, IOTA is trying to break above the 100-three-day moving average on its 3-day chart which is serving as an important level of resistance. Closing above this price hurdle could allow it to continue surging to the next level of resistance given by the 200-day moving average. This barrier is currently sitting at $0.40.

Nevertheless, it appears that breaking above the 100-three-day moving average will not be easy. The TD sequential indicator is currently presenting a sell signal in the form of a green nine on IOTA’s 12-hour chart. This bearish formation predicts a one to four candlestick correction or the beginning of a new downward trend.
If the sell signal presented by the TD sequential indicator is validated, IOTA could plunge to try to find support around the 38.2 or the 50 percent Fibonacci retracement levels. These levels of support sit at $0.25 and $0.23, respectively.
However, a spike in volume that takes IOTA to close above the recent high of $0.31 could signal a continuation of the bullish trend. If this happens, one could expect a further advance to the next level of resistance around $0.34.
Overall sentiment
Ethereum Classic, Cardano, and IOTA appear to be bound for a retracement following the substantial bull rally that these cryptocurrencies experienced since mid-December 2019. Although a correction seems imminent, it could serve as take profit point for investors and as an opportunity for sideliners to get back in the market. A new inflow of capital would likely allow these cryptos to continue their uptrends.
This scenario can also be seen on the altcoins dominance chart. At the moment, the altcoins dominance appears to be forming an ascending triangle on the 1-day chart. Following the recent retest of the upper boundary of the triangle, the altcoins dominance could retrace to the hypotenuse.
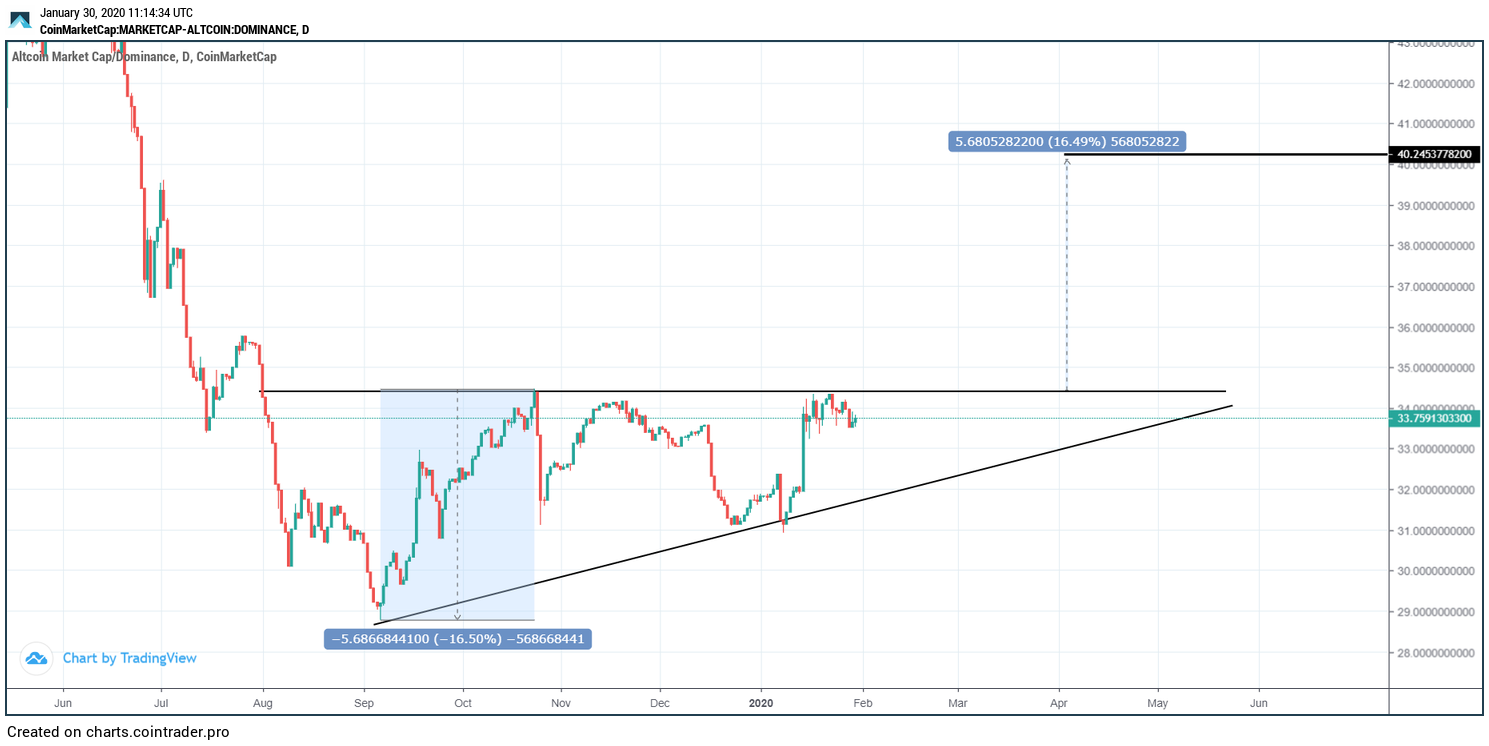
It is worth noting that a bullish impulse may allow the altcoins dominance to break out of the ascending triangle where it has been contained since August 2019. This could trigger a further advance allowing altcoins to capture a 43 percent of the cryptocurrency market share.
It remains to be seen when altcoins dominance would be able to breakout of this pattern. But, when that happens, a new full blown “altseason” would likely start.