Supply Last Active 2+ years ago hits over 50% of the circulating supply
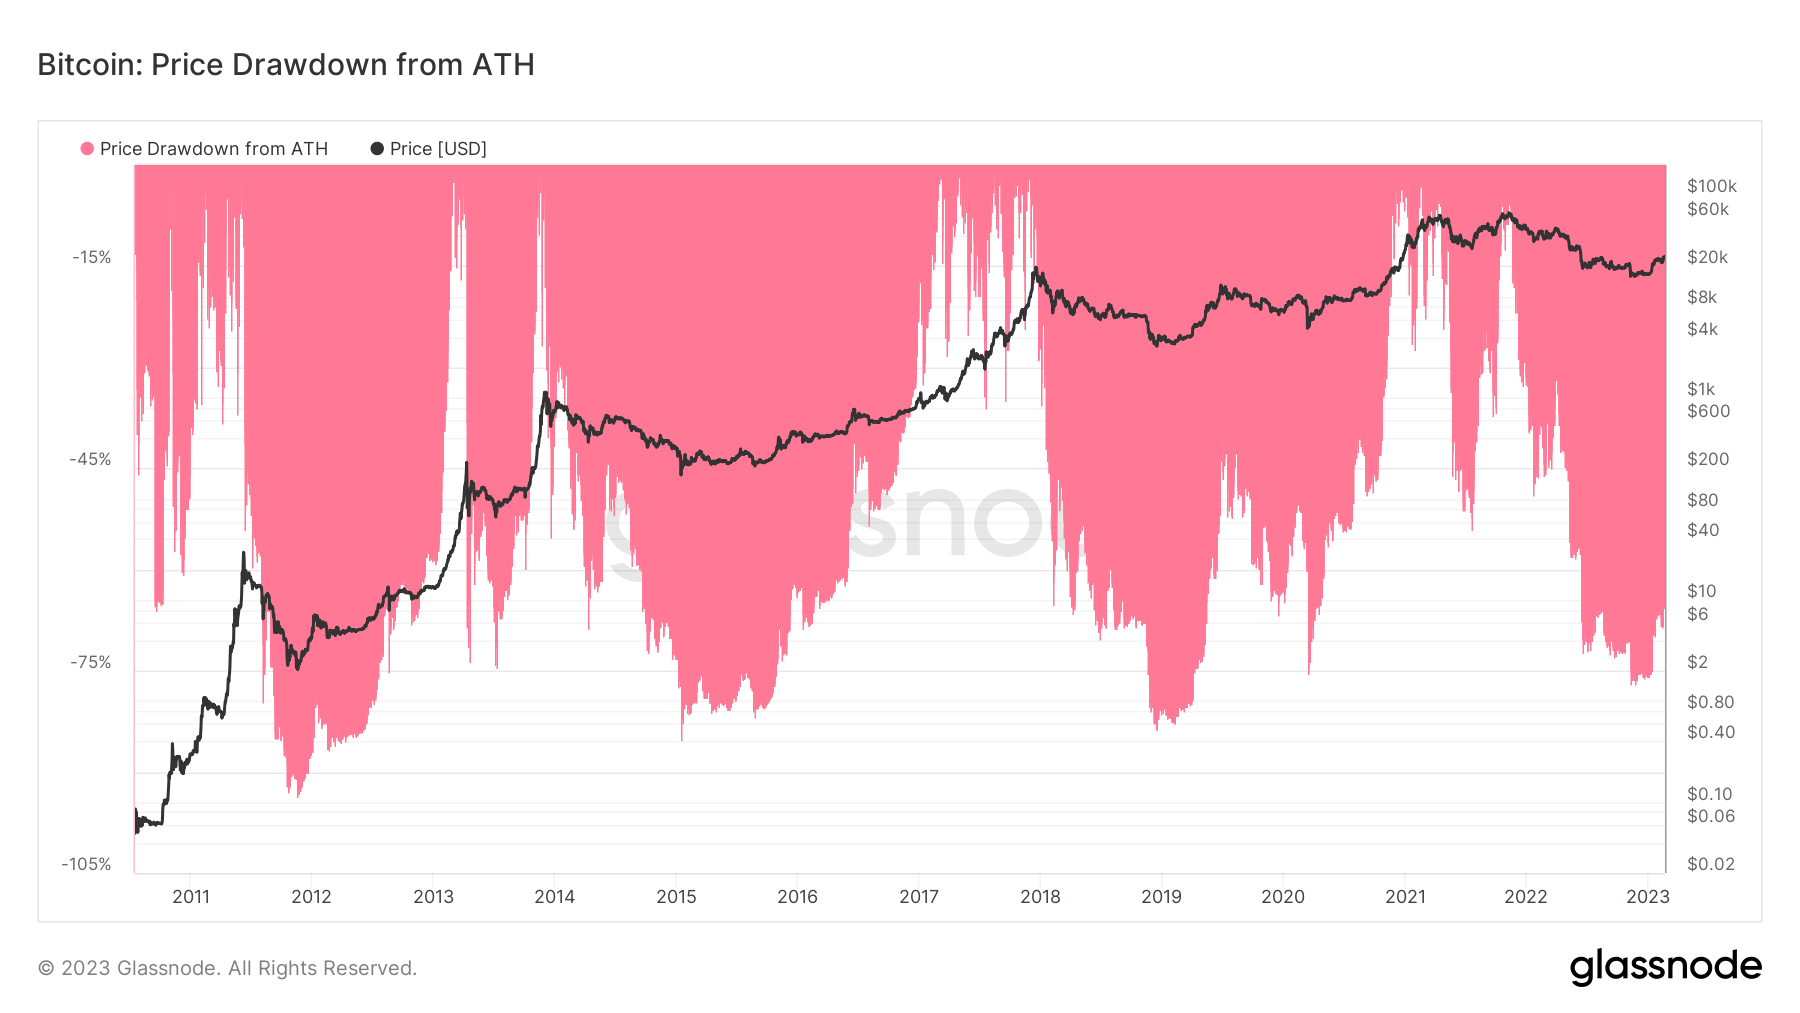
50% of the circulating supply have held Bitcoin for 2+ years, have experienced a 75% drawdown in terms of market cap.
This article was published 3 years ago. Some details may no longer reflect current market conditions or recent developments. If you spot anything that needs an update, contact us.
Definition
As investors accumulate and store (or lose) coins for longer periods, we can categorize them based on how long it has been since they last moved on-chain.
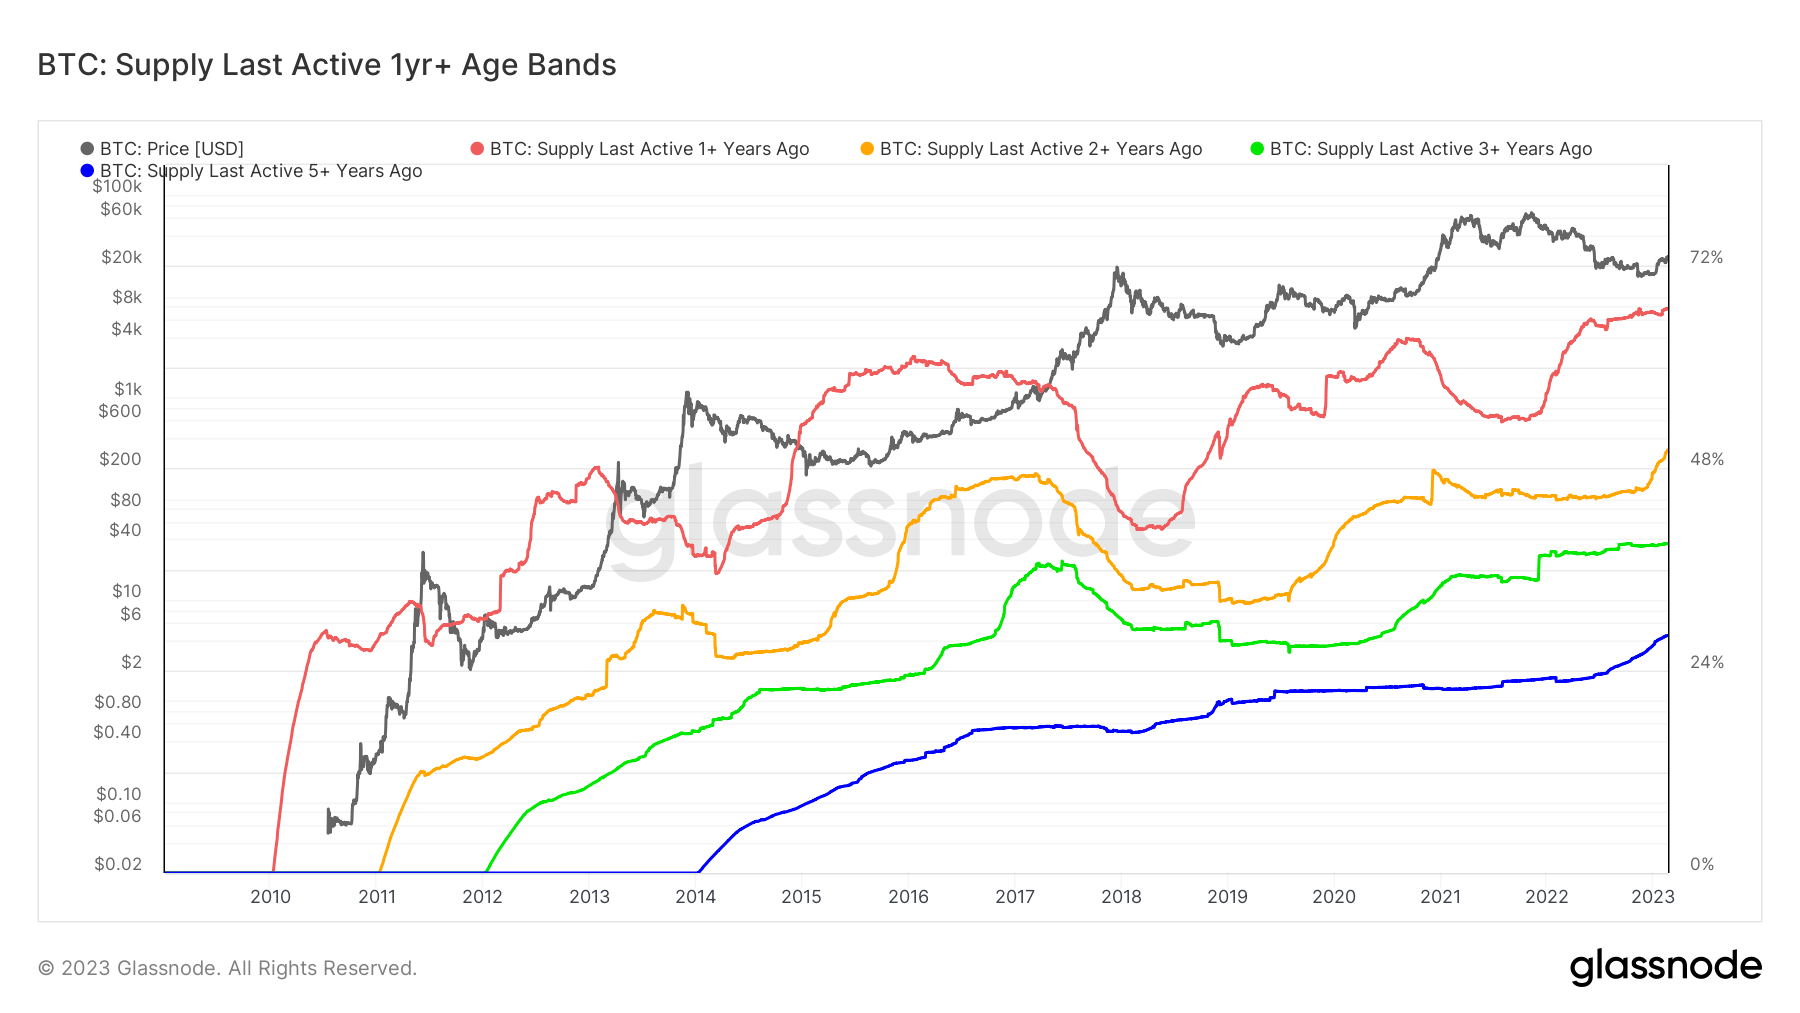
This chart displays an overlay of multiple Supply Last Active variants, each shown as a percentage of Circulating Supply.
- Supply Last Active 1+ Yrs Ago 🔴
- Supply Last Active 2+ Yrs Ago 🟠
- Supply Last Active 3+ Yrs Ago 🟢
- Supply Last Active 5+ Yrs Ago 🔵
As longer-term investors accumulate coins, these metrics will tend to rise. Conversely, as long-term investors spend and distribute their coins, this metric will decline, with older coins becoming young again as they change hands.
Quick Take
- Supply's last active 2+ years ago hit 50% of the circulating supply for the first time.
- This cohort bought Bitcoin during the 2021 bull run, while Bitcoin price was roughly $58,000 two years ago.
- All other categories have also hit all-time highs recently.
Events that have occurred since then
- The price of Bitcoin has dropped 75% from its all-time high.
- Summer of 2021, China banned mining Bitcoin, which subsequently saw the hash rate drop by over 35%.
- The collapse of FTX and Luna and a looming recession on the horizon.