Research: HODL waves show short-term holders at level lower than 2019 bear market bottom
On-chain data indicates a drastic fall in short-term Bitcoin holders with the number dropping to 27.4%. Market bottoms historically correlate with short-term holders falling below 29%

Cover art/illustration via CryptoSlate. Image includes combined content which may include the use of AI tools.
HODL Waves are an indicator that bundles all active supply addresses by age bands. Each colored band shows the percentage of Bitcoin in existence that was last moved within the time period denoted in the legend.
A review of the current state of the HODL Waves chart by CryptoSlate indicates that short-term holders are at a lower level than the bottom of the 2016 – 2020 halving cycle.
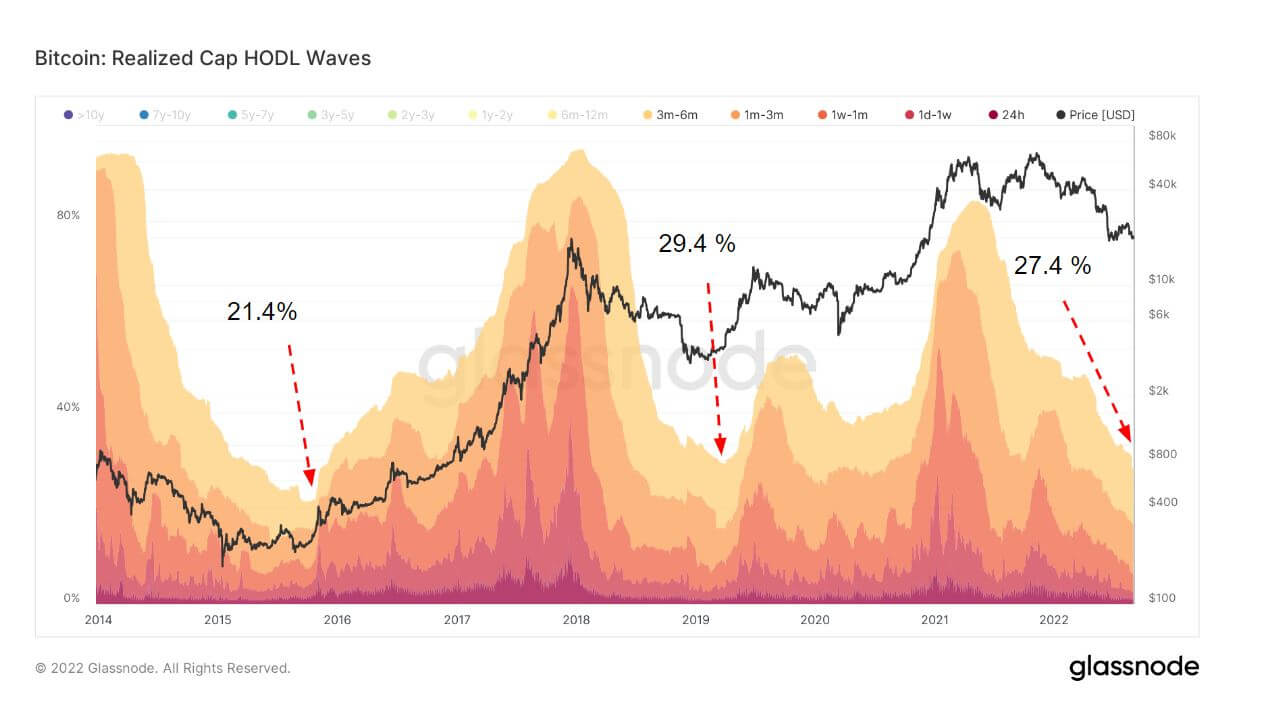
Short-term holders are defined as a cohort holding bitcoin for less than 155 days. Short-term holders typically buy in strength during bull runs and distribute when prices start to drop due to increased price sensitivity.
The realized cap HODL Waves chart above showcases that short-term holders hold a significant amount of coins and historically contribute to the floor of bear markets. In 2015 short-term holders made up 21.4% and in 2019, it was over 29%. Presently, it is 27.4% marking a traditionally important moment within the halving cycle.
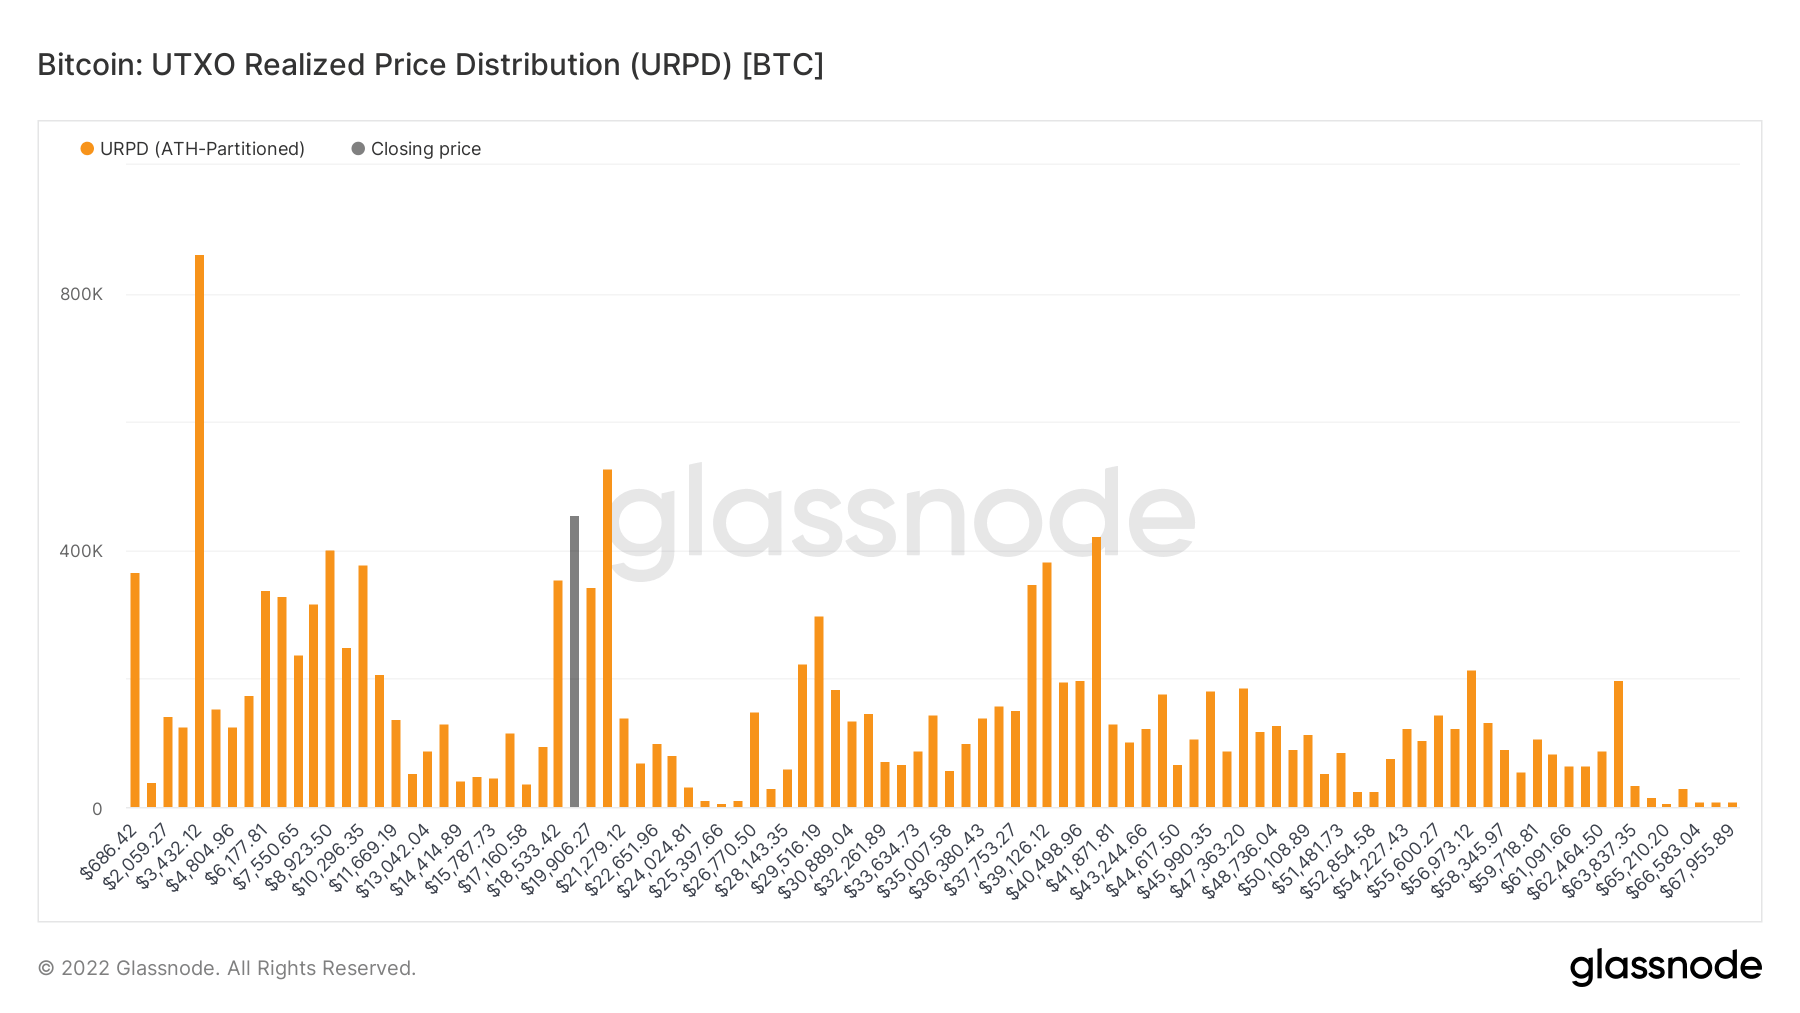
Short-term holders bought when BTC dropped below the psychological support at $20,000. The Unrealized Price Distribution (URPD) metric supports this thesis as a significant amount of concentrated coins have been bought around $17.5k to $22k. The overwhelming majority of holders, however, are long-term holders which form the base.
The important factor to remember is that Bitcoin has never had to navigate a global recession or Quantitative Tightening. Since 2009, Bitcoin has had the benefit of riding a wave of rising asset prices across myriad markets. While short-term holders drop to levels typical of a market bottom, on-chain metrics will have to contend with other macro factors amid soaring inflation and continued money printing.
However, one potentially positive indicator is the fact that the M1 money supply in the US has finally ticked down after reaching a high of $20.69 trillion. Updated numbers for August will be released later in September, yet, the most recent figures from July show the money supply dropping to $20.51 trillion.
Strong on-chain data can be seen as a signal of when Bitcoin is ready to head back towards a bull run when the global macro environment allows for it.