History shows Ethereum’s mid-term uptrend isn’t over despite 30% pullback

Cover art/illustration via CryptoSlate. Image includes combined content which may include the use of AI tools.
Ethereum has been hit hard by the recent market-wide downturn, with the retrace seen by the decentralized finance sector likely being the main suspect behind this weakness.
The cryptocurrency rallied up towards $500 earlier this month, marking a massive extension of the uptrend that started in mid-March when it plummeted beneath $100.
Over the past couple of months, the gains seen by ETH have been primarily driven by a massive surge in demand for the network, which has translated into demand for the cryptocurrency.
As the DeFi trend started cooling off earlier this month, however, Ethereum took a major hit, with its price ultimately reeling down to lows of $318 that were revisited today.
Despite the gravity of this decline, history shows that it is not unusual for Ethereum to see multiple 20 percent+ pullbacks during uptrends.
That being said, if history repeats itself, ETH may be able to climb significantly higher in the months ahead despite the overt weakness seen as a result of this recent decline.
Ethereum rebounds from lows as bulls defend lower-$300 region
At the time of writing, Ethereum is trading up 8 percent at its current price of $346, which marks a massive spike from its recent lows of $318.
These lows were set in tandem with Bitcoin’s decline down to lows of $10,200, which is around the point at which bulls conducted what appears to be a short squeeze that pushed its price up towards $10,800.
Where Ethereum trends next will likely depend primarily on Bitcoin, as the benchmark cryptocurrency has been firmly leading the entire market over the past few days and weeks.
History shows ETH will likely see plenty more drawdowns during its next uptrend
Although the severity of this recent pullback has made it seem like $490 may be a mid-term top for Ethereum, an analysis of the cryptocurrency’s previous uptrends suggests that it could see plenty of more pullbacks as it climbs higher.
According to an analysis conducted by the research platform Messari, Ethereum saw a total of seven pullbacks greater than 20 percent throughout the course of its 2017 price boom.
“During the 2017 ICO boom, ETH pulled back 20%+ seven times before it peaked in January 2018. This cycle, ETH has pulled back 20%+ only once.”
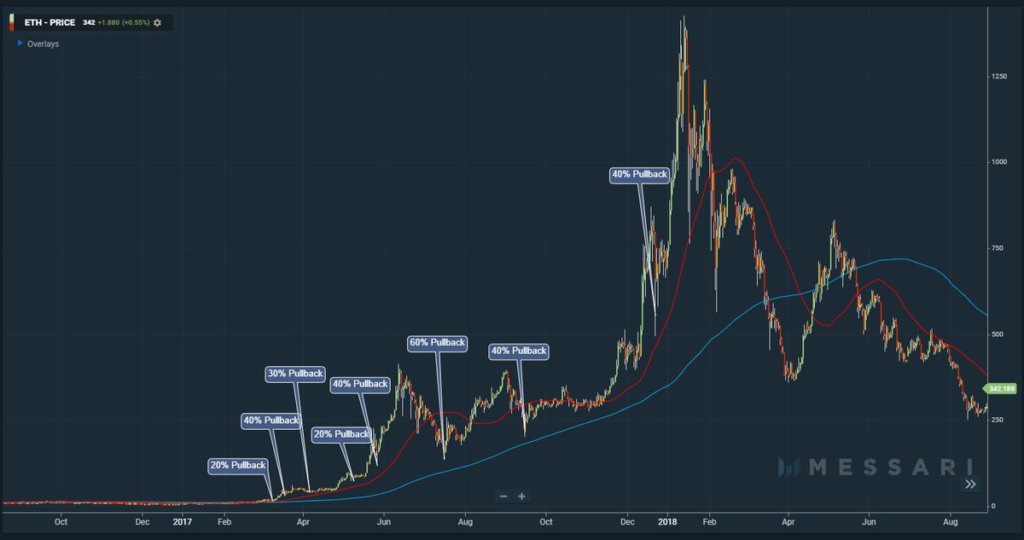
As seen on the above chart, although this recent pullback may have invalidated Ethereum’s short-term market structure, its macro outlook remains incredibly bright.
Pricing data for ETHUSD via TradingView.