Casino promo codes are still a thing in the crypto gambling industry. Even nearly two decades since they first appeared, they are still highly sought after as they help players land the deal they were promised. Here are the currently available crypto casino promo codes which you can claim today. We make sure that the offer and information is updated regularly to ensure you get the details before you set your mind to it.
Top Casino Promo Codes
- Bonus
- 100 free spins on $50
- Wagering
- 1x
- Payout
- 10–12 min
- Weekly and monthly VIP reward drops
- $40,000 weekly slots and live-casino tournament
- Diamond VIP manager through Telegram
- Bonus
- 300% match up to $6,000
- Wagering
- 35x bonus
- Payout
- Crypto: mins–hrs once approved
- Boss Club returns 10–15% of the house edge
- Personal VIP manager from Boss Club Level 5
- $100,000 weekly crypto withdrawal limit
- Bonus
- 4 monthly deposit bonuses
- Wagering
- Unlocks by house edge x 1%
- Payout
- 24 hours
- Four deposit bonuses that reset every month
- No-expiry bonus at every VIP level-up
- Invitation-only VIP club with a personal host
- Bonus
- Up to 1 BTC + 225 Free Spins
- Wagering
- 40x bonus + free-spin
- Payout
- 0-2 days
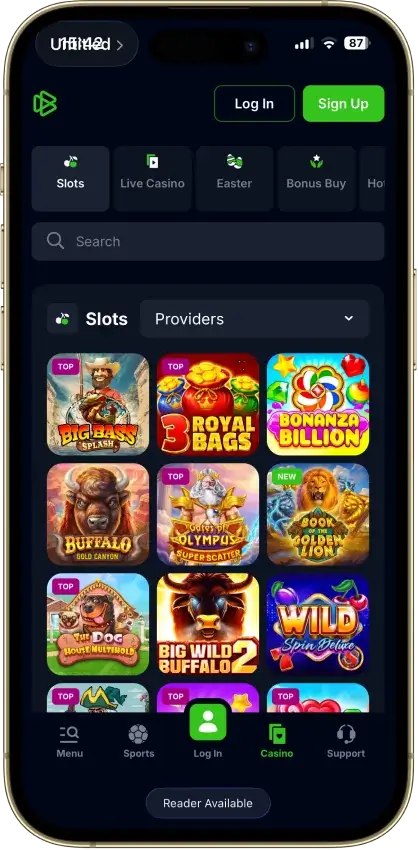
- One of the largest game libraries in crypto
- Daily, weekly and weekend casino promotions
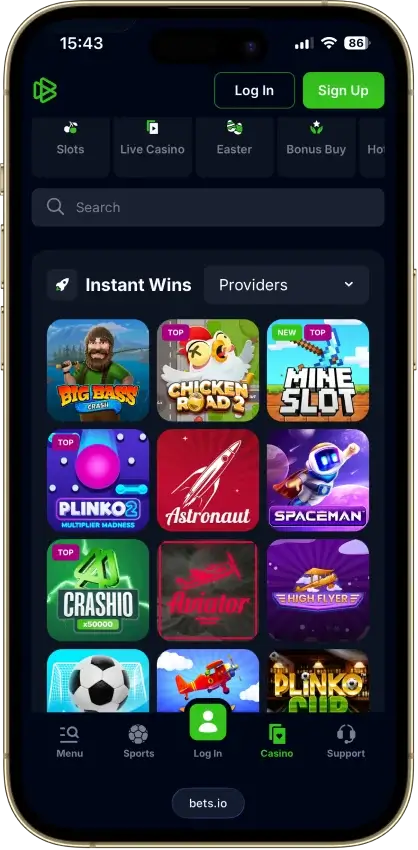
- Instant-win section well above average
- Bonus
- Exclusive 100 no-wager spins
- Wagering
- 10x deposit per mission
- Payout
- Instant
- Live since 2014, rare crypto track record
- Monday reloads of 25% to 50% from Silver
- 20-tier ladder with cashback and rakeback
- Bonus
- 4 deposits: 5 BTC + 180 spins
- Wagering
- 40x bonus + spin winnings
- Payout
- Crypto: ~10m once approved
- Weekly Table Wars tournament for table players
- Level Up Adventure races your own progress bar
- No fees or limits on crypto withdrawals
- Bonus
- Up to $1,750 + 60 spins
- Wagering
- 40x deposit + bonus (locked)
- Payout
- Crypto: <15m after checks
- Choose how your welcome bonus unlocks
- $1,000,000 monthly race on top of daily and weekly
- Rakeboost after every reward claim
- Bonus
- 100% first deposit up to $1,000
- Wagering
- 30x deposit + bonus
- Payout
- Crypto: near-instant if clear
- Live RTP board tracks each slot's recent payout
- Home of Mission Uncrossable, a Roobet exclusive
- Crypto play earns 10% more rakeback than fiat
- Bonus
- 100% up to $1,000; $20 min
- Wagering
- 35x deposit + bonus
- Payout
- Crypto: mins if no review
- Native SHFL token, lottery and airdrops
- $100,000 weekly race, 1,000 winners paid
- Rank-up rewards grow after a losing run
- Bonus
- 200% up to $2,000; Level 2 KYC
- Wagering
- 40x deposit + bonus
- Payout
- 0–2 days; KYC may extend
- $100,000 race every day, 5,000 places paid
- Slots you can only play on Stake
- Games from 260+ studios, the most we've seen
- Monday loss-back rising to 20% at top VIP
- Hot RTP collection for picking slots
- Comp points convert to bonus funds
CryptoSlate may earn a commission when you visit partner sites through links on this page, at no extra cost to you. Our rankings and reviews remain editorially independent and based on our published methodology. Read disclosure
Disclaimer: CryptoSlate may receive a commission when you click links on our site and make a purchase or complete an action with a third party. This does not influence our editorial independence, reviews, or ratings, and we always aim to provide accurate, transparent information to our readers.You don't need to copy and paste the codes as they are applied to the links we use. Basically, you just follow the link, and when you arrive at the crypto casino, the system knows which bonus code or promo code to apply. However, if you feel more comfortable copying and pasting it yourself, you can do so and you will still benefit from the promo code.
Note, make sure you provide the code at the correct step:
- during registration
- during depositing
Comparison Table
| Casino | Bonus Offer | Wagering Requirement | Number of Games | Game Types | KYC | Launch Date |
|---|---|---|---|---|---|---|
 Jack Jack | Current OfferDeposit $50, Get 100 Free Spins on Hot Chilli Bells | — | 10,400 | — | No KYC (Risk-based) | 2026 |
 CasinOK CasinOK | Current OfferThree 100% deposit matches up to $2,000 each, from a $20 first deposit | — | 9,089 | — | No KYC (Risk-based) | 2025 |
 BC.Game BC.Game | Current Offer180% to 360% deposit match plus 40% to 140% rakeback, by tier | — | 7,200 | — | No KYC (Risk-based) | 2017 |
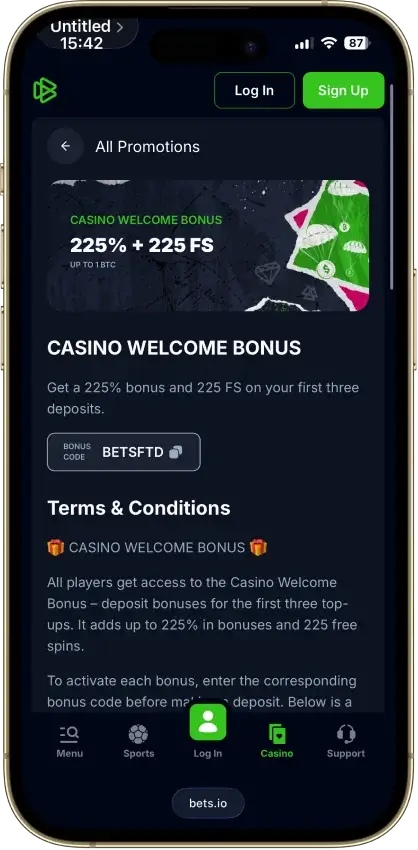
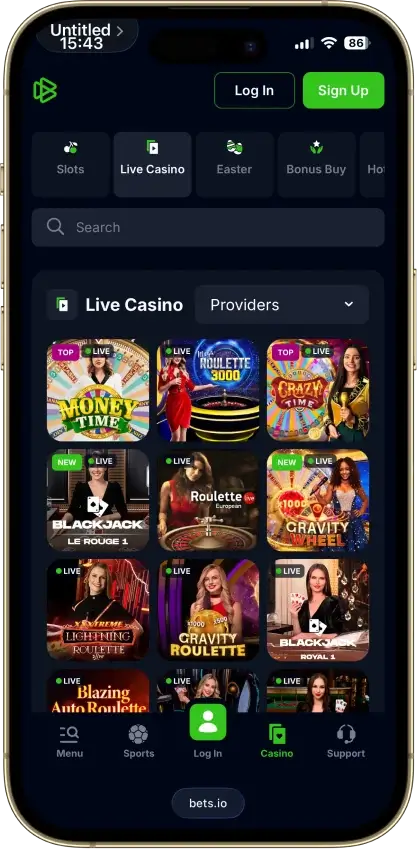
 Bets.io Bets.io | Current Offer225% and 225 free spins across three deposits, up to 1 BTC | — | 14,488 | — | No KYC (Risk-based) | 2021 |
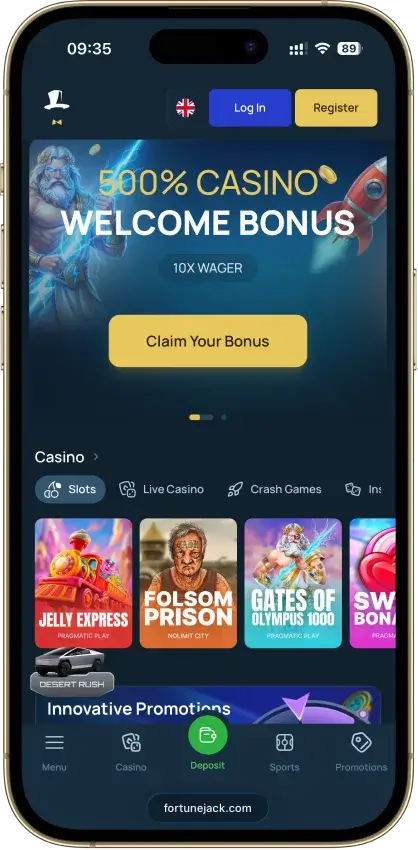
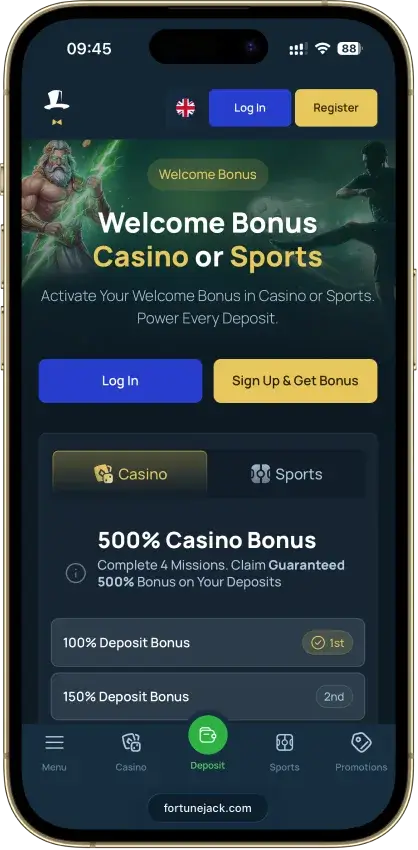
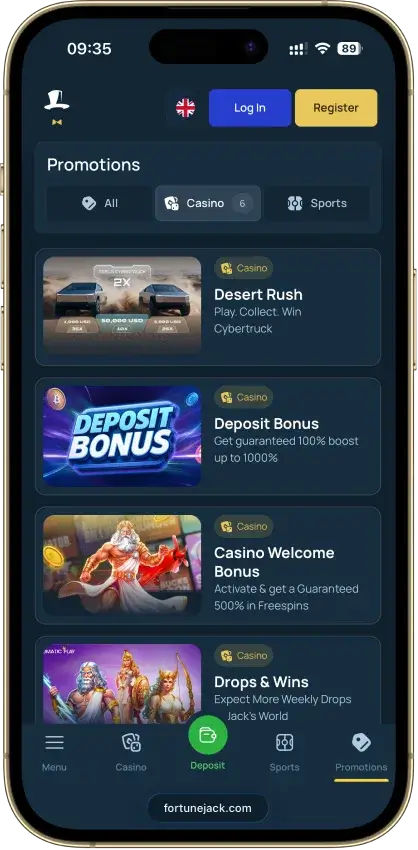
 FortuneJack FortuneJack | Current Offer100 No-Wager Spins + Welcome Pack | — | 5,414 | — | No KYC (Risk-based) | 2014 |
 BitStarz BitStarz | Current Offer50 no-deposit free spins and up to 5 BTC + 180 free spins | — | 8,245 | — | No KYC | 2014 |
 Rainbet Rainbet | Current OfferUp to $1,750 across the first three deposits | — | 7,000 | — | No KYC (Risk-based) | 2023 |
 Roobet Roobet | Current Offer100% deposit match up to $1,000 | — | 7,000 | — | No KYC (Risk-based) | 2019 |
 Shuffle Shuffle | Current Offer100% up to $1,000 | — | 5,700 | — | No KYC (Risk-based) | 2023 |
 Stake Stake | Current Offer200% deposit bonus up to $2,000 | — | 6,000 | — | No KYC (Risk-based) | 2017 |
 7Bit Casino 7Bit Casino | Current OfferUp to $5,400 or 5.25 BTC + 250 free spins | — | 7,000 | — | No KYC | 2014 |
The Wagering Requirement column says whether the multiple applies to the bonus alone or to the deposit and bonus together. On a 100% match, 40x deposit plus bonus means betting 80 times the bonus amount, twice as much as 40x bonus only. In the KYC column, “No KYC (Risk-based)” means the casino can still ask for ID when a withdrawal or unusual account activity triggers a review.
Casino Promo Codes
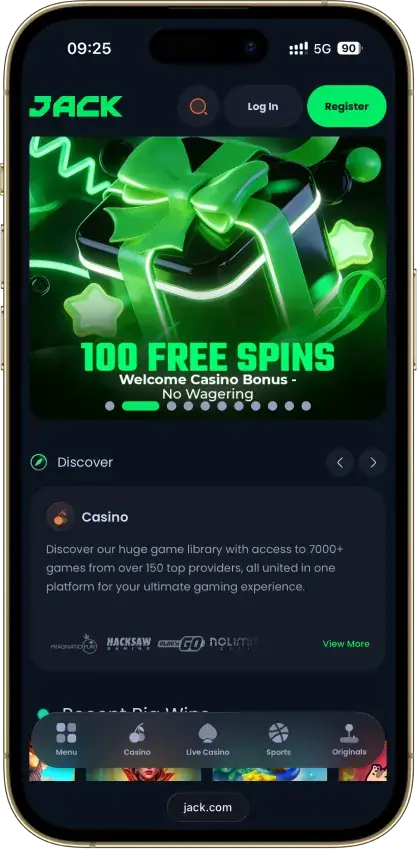
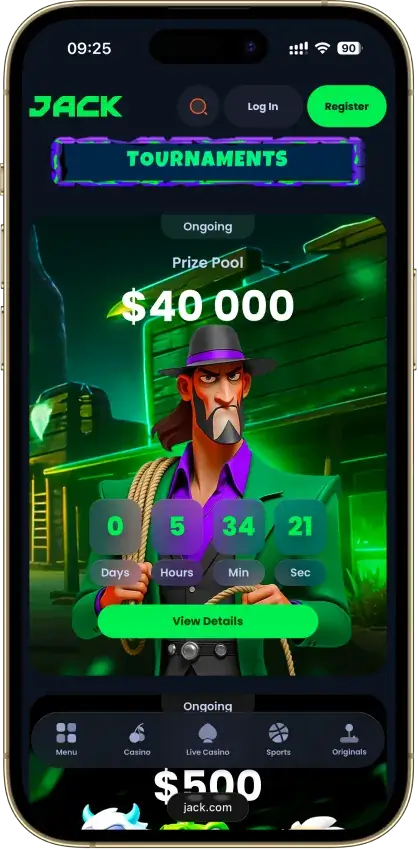
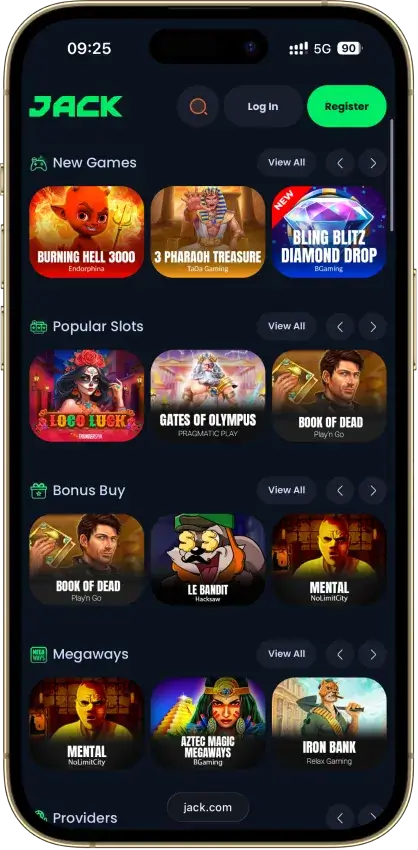
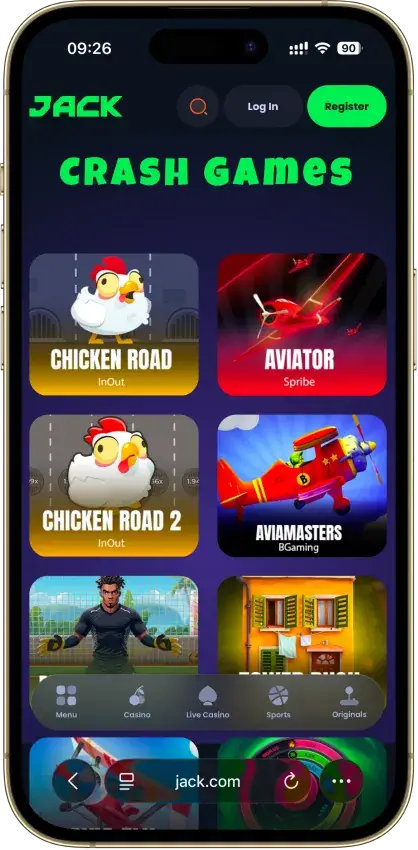
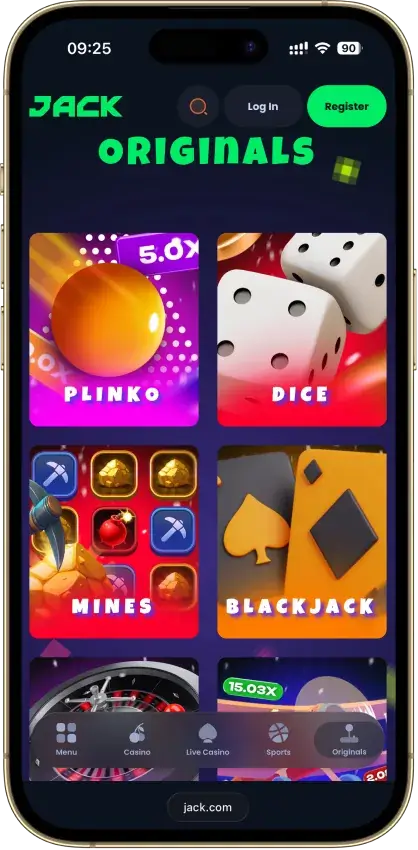
Jack
- Bonus
- 100 free spins on $50
- Wagering
- 1x
- Payout
- 10–12 min
Pros
- Routine crypto withdrawals in 10 to 12 minutes
- 1x wagering on deposit + free-spin winnings
- Multiple networks for stablecoin funding
- Bonus terms spelled out, no hidden rules
- Level-up bonuses start at Bronze
Cons
- Rakeback cash wins limited to 10x the bonus
- Limited casino game filters
- Welcome spin winnings limited to $100
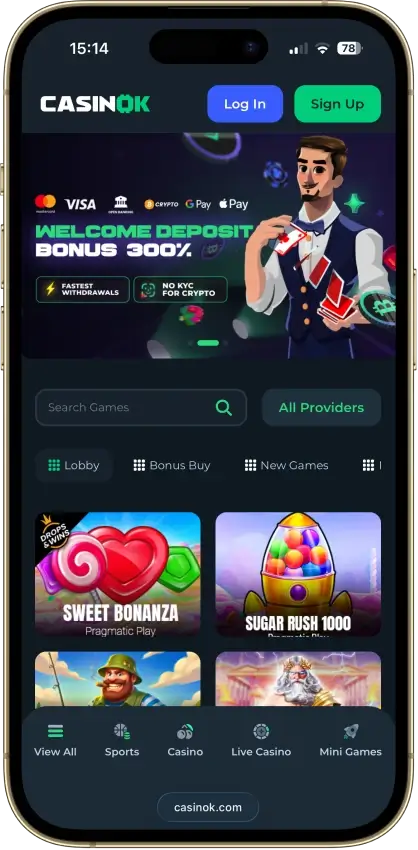
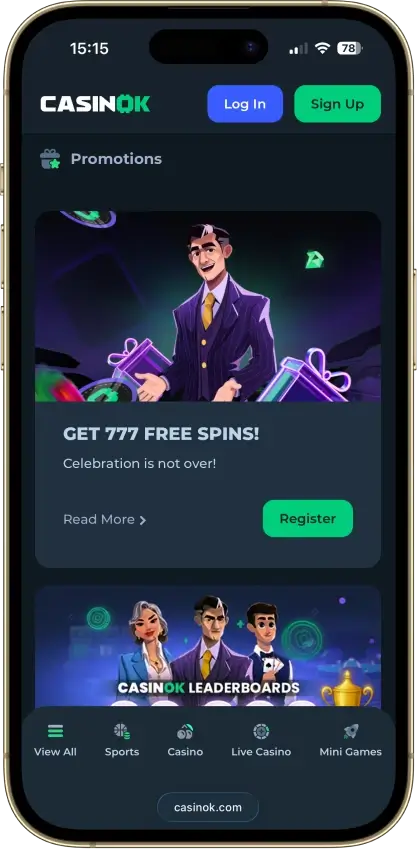
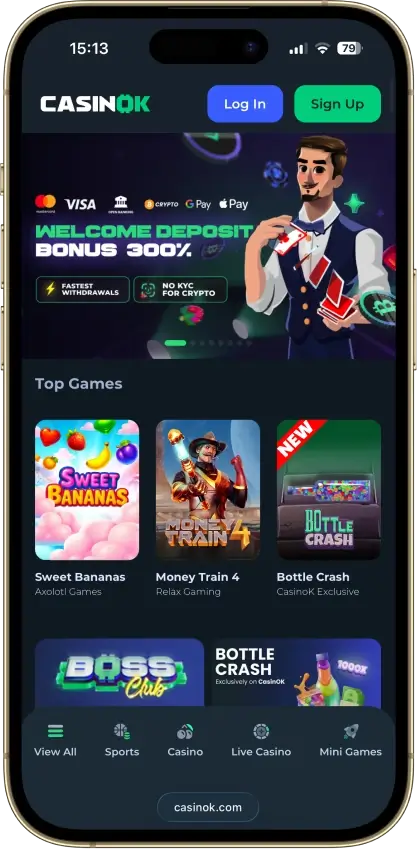
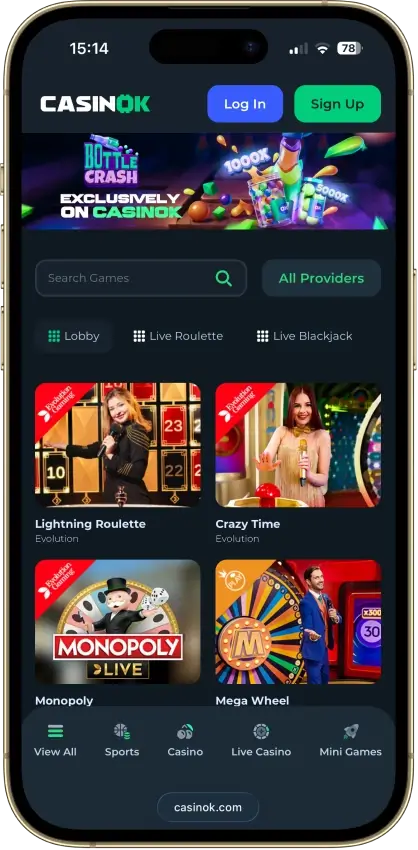
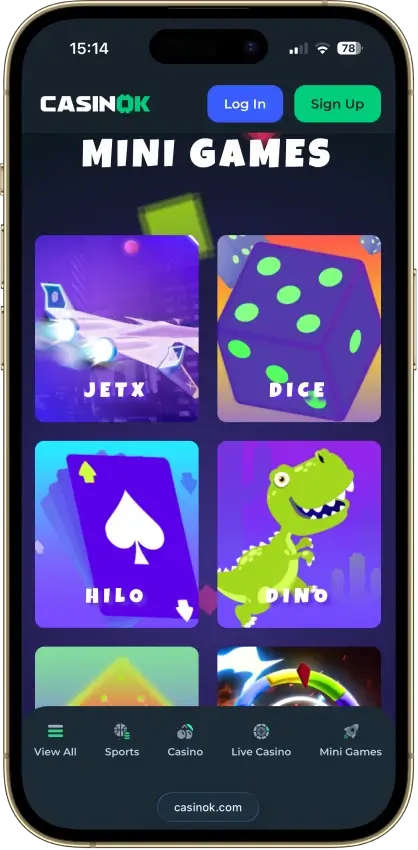
CasinOK
- Bonus
- 300% match up to $6,000
- Wagering
- 35x bonus
- Payout
- Crypto: mins–hrs once approved
Pros
- 10% weekly cashback, 1x wagering
- No rollover on Boss Club free-spin winnings
- Points convert to cash from $5, no wagering
- 24/7 live chat
- Cards and e-wallets in supported regions
Cons
- Bonus winnings have a cashout limit
- Weekly cashback has a $4 maximum bet
- Wagering base for the 35x match is unstated
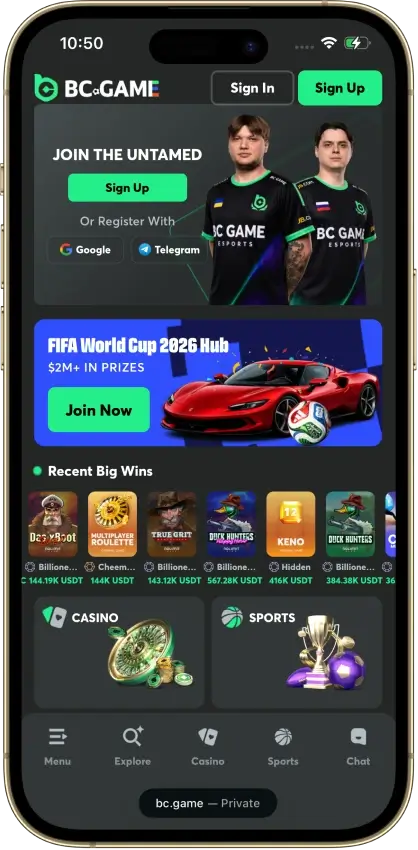
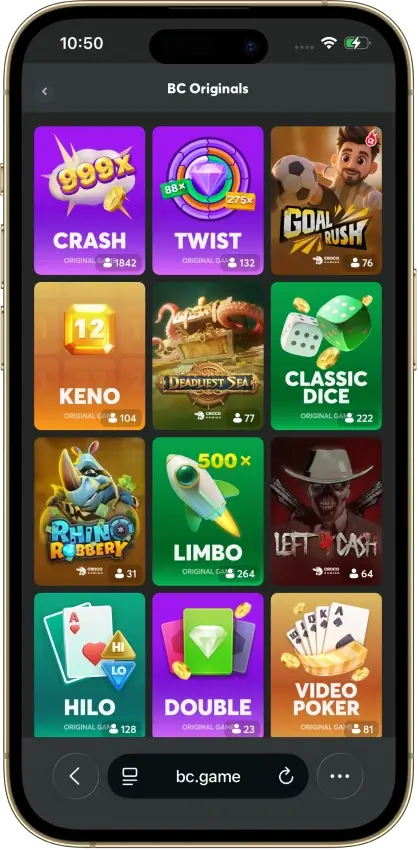
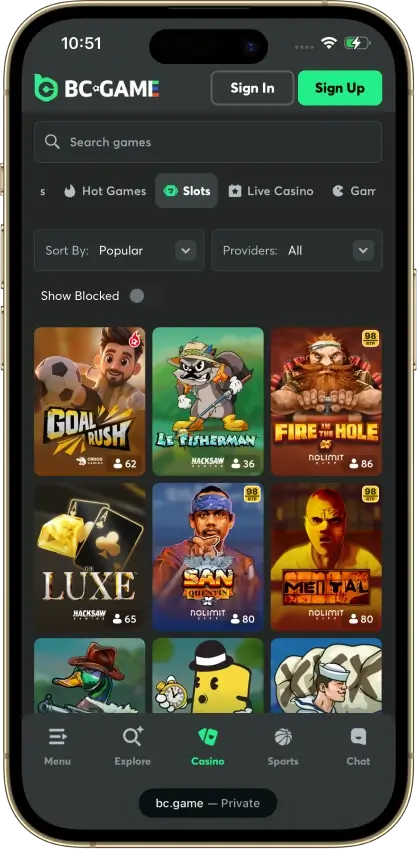
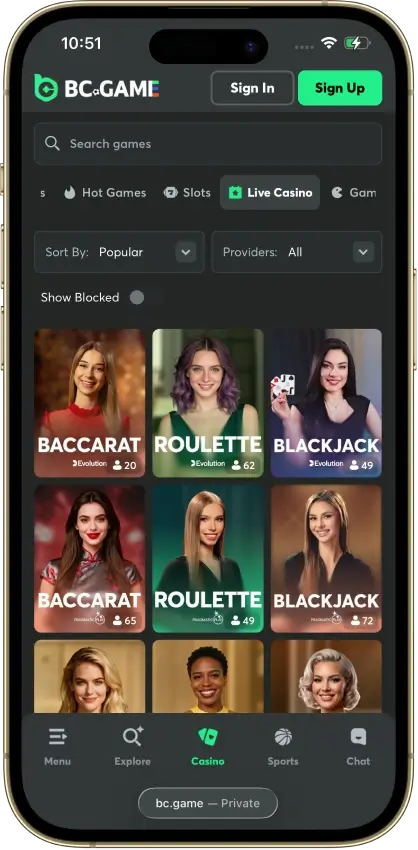
BC.Game
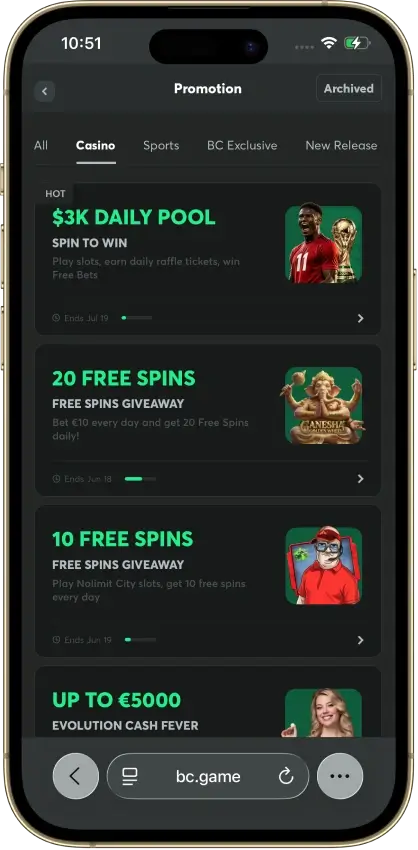
- Bonus
- 4 monthly deposit bonuses
- Wagering
- Unlocks by house edge x 1%
- Payout
- 24 hours
Pros
- Fast crypto withdrawals once verified
- First monthly bonus stage needs just $5
- 20 wager-free spins a day on a featured slot
- Bitcoin Lightning deposits accepted
- Swap coins in your wallet with BC Swap
Cons
- Monthly withdrawal limit of €10,000
- Limit halves once balance tops 10x deposits
- Daily bonus expires if not claimed within 24 hours

Bets.io
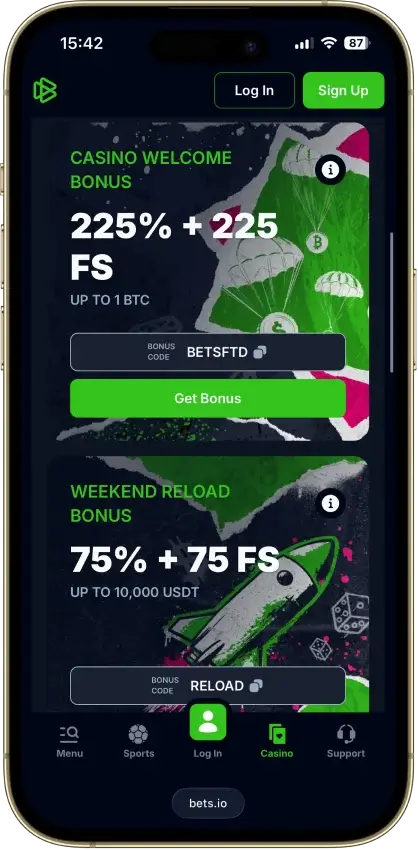
- Bonus
- Up to 1 BTC + 225 Free Spins
- Wagering
- 40x bonus + free-spin
- Payout
- 0-2 days
Pros
- 950 live-dealer tables and game shows
- Both crypto and full fiat cashier
- Daily cashback of 5% to 10%
- Weekend reload of 75% up to 10,000 USDT
- Bets Points convert to cash from Silver
Cons
- 2 USDT max bet while clearing welcome bonus
- Only one bonus active at a time
- Welcome bonus wins limited to 5x deposit
- Daily withdrawal limit starts at 1,000 USDT
- Wins above 30,000 USDT paid on a schedule
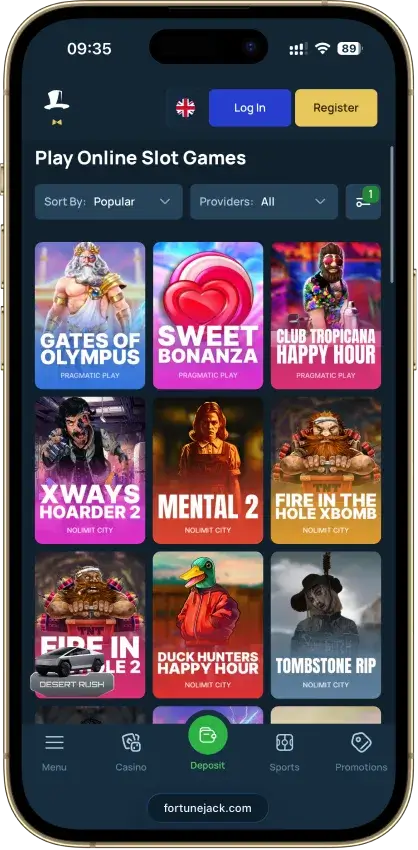
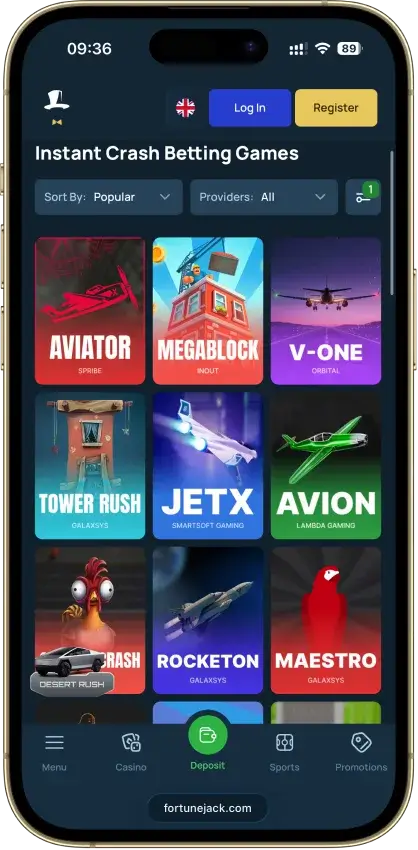
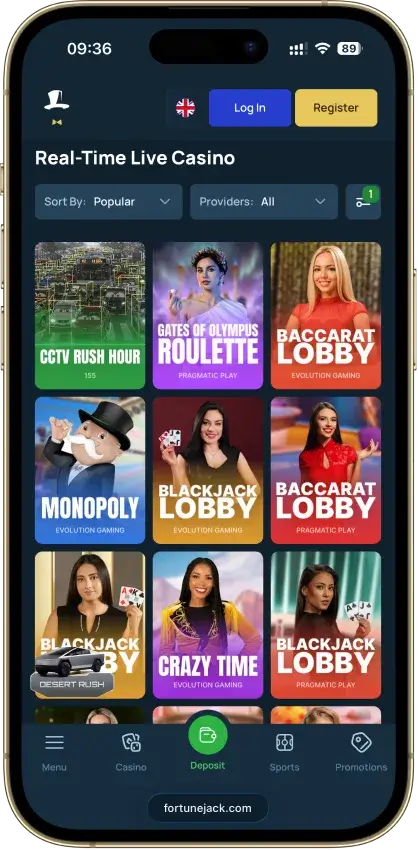
FortuneJack
- Bonus
- Exclusive 100 no-wager spins
- Wagering
- 10x deposit per mission
- Payout
- Instant
Pros
- Fast routine crypto payouts
- Multi-network USDT and USDC support
- Monthly loss cashback of up to 15%
- Daily rakeback paid as real money
- Withdrawal fees shown before you cash out
Cons
- Live casino excluded from welcome missions
- Free spins expire in three days
- No RTP filter in the slot lobby
- Daily rakeback has a 24-hour claim window
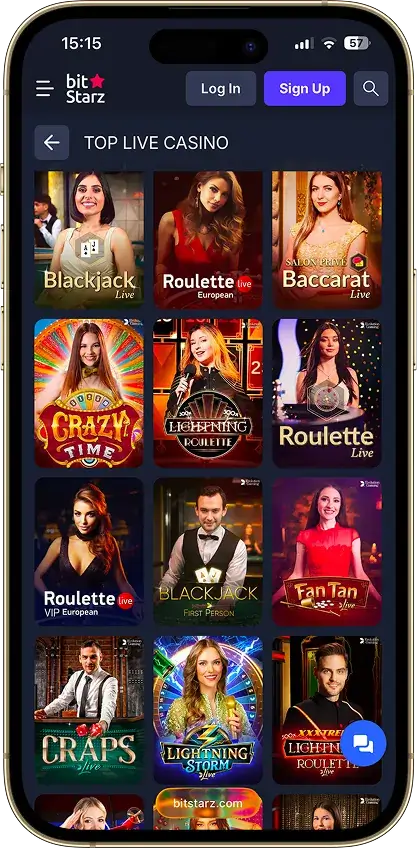
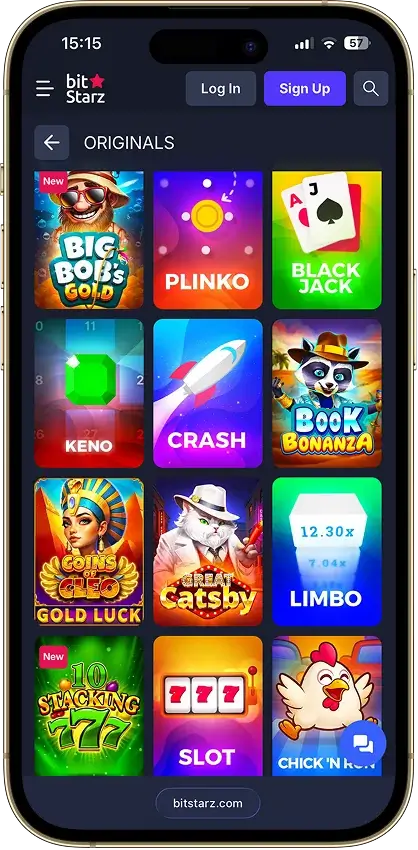
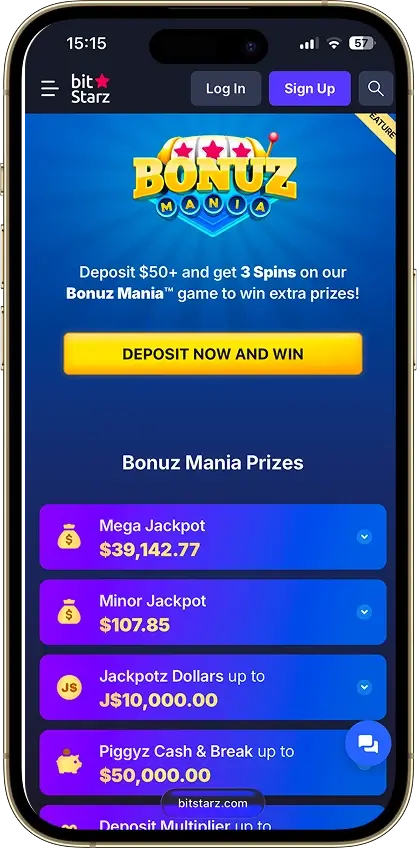
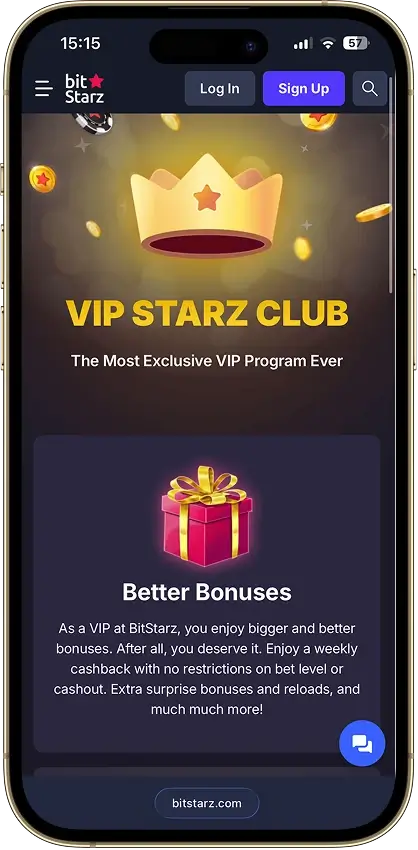
BitStarz
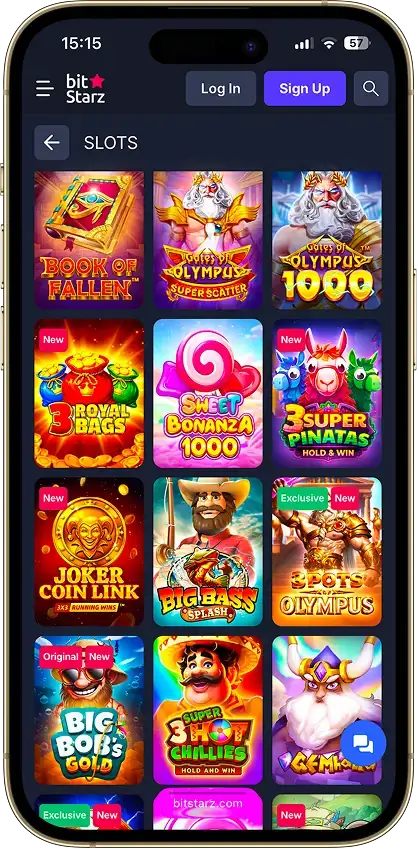
- Bonus
- 4 deposits: 5 BTC + 180 spins
- Wagering
- 40x bonus + spin winnings
- Payout
- Crypto: ~10m once approved
Pros
- Bitcoin Lightning deposits
- Welcome wagering applies to bonus only
- Monday 50% reload up to €300
- 24/7 live chat, ~1-min response
- 300+ more coins through the built-in Exchange
Cons
- $5 max bet while a bonus is active
- $5/month fee after 6 months idle
- Large wins can be paid in monthly installments
- RTP hidden until you open a game

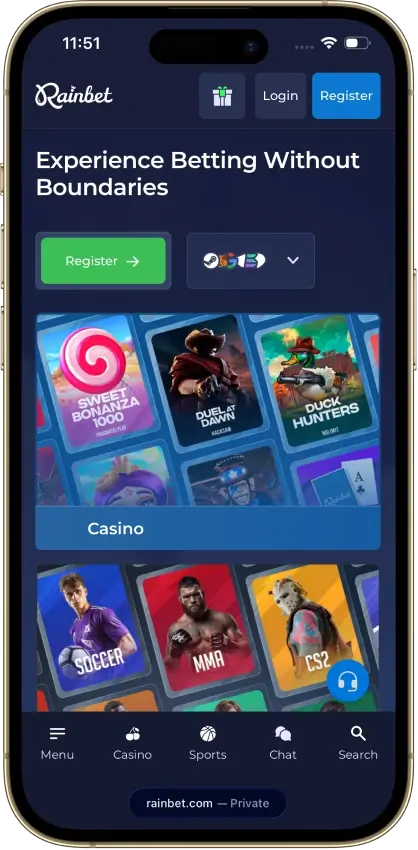
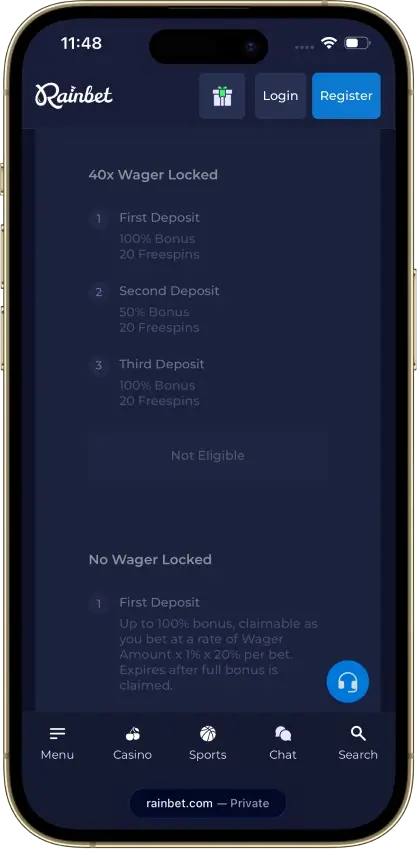
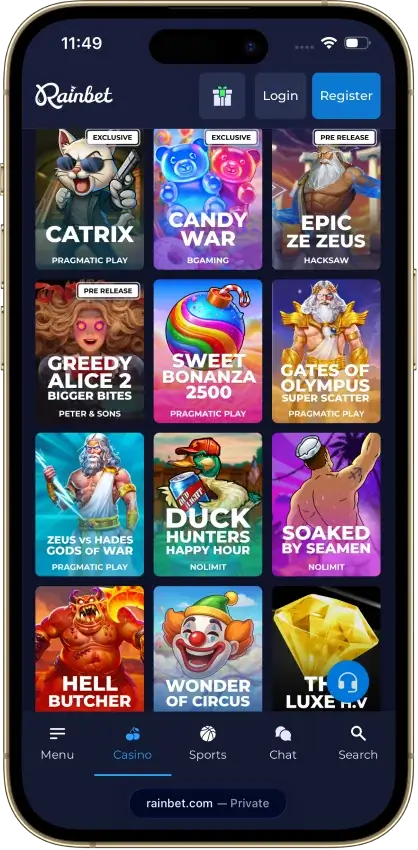
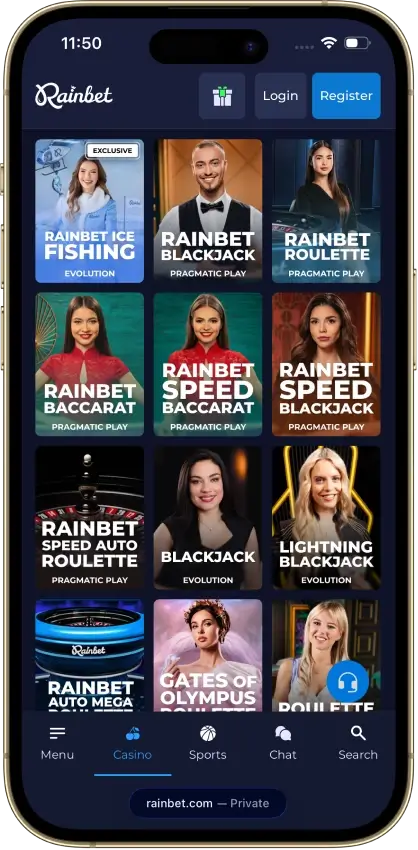
Rainbet
- Bonus
- Up to $1,750 + 60 spins
- Wagering
- 40x deposit + bonus (locked)
- Payout
- Crypto: <15m after checks
Pros
- Reload bonuses offered three times daily
- Rakeback paid as withdrawable cash
- USDC on seven networks, USDT on five
- Mesh deposits from connected wallets
- VIP representative from Platinum
Cons
- Code-bonus cashouts limited to $50
- Slots filter includes other game categories
- Games over 97.4% RTP blocked during bonus play
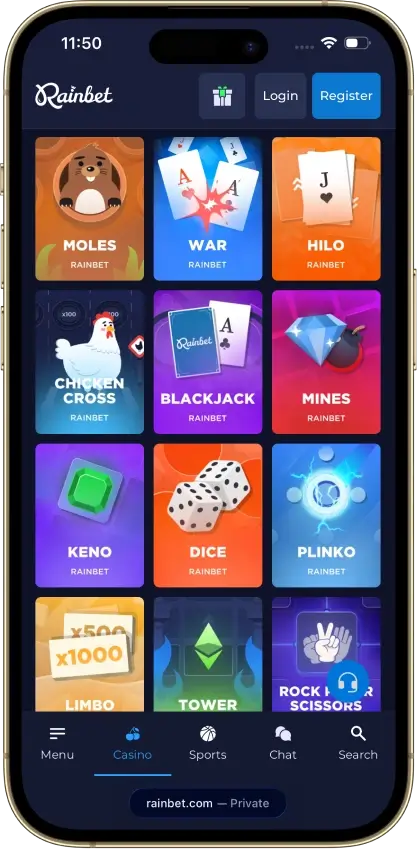
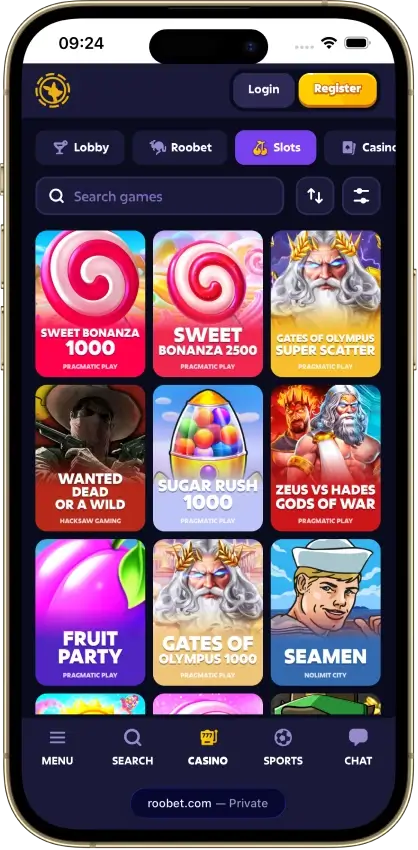
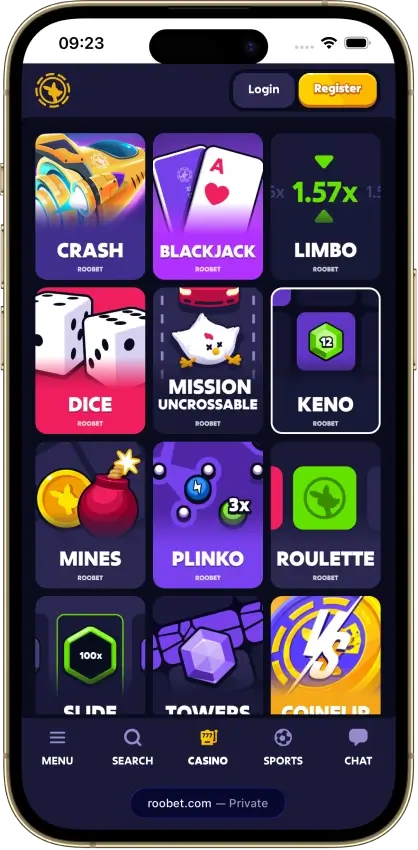
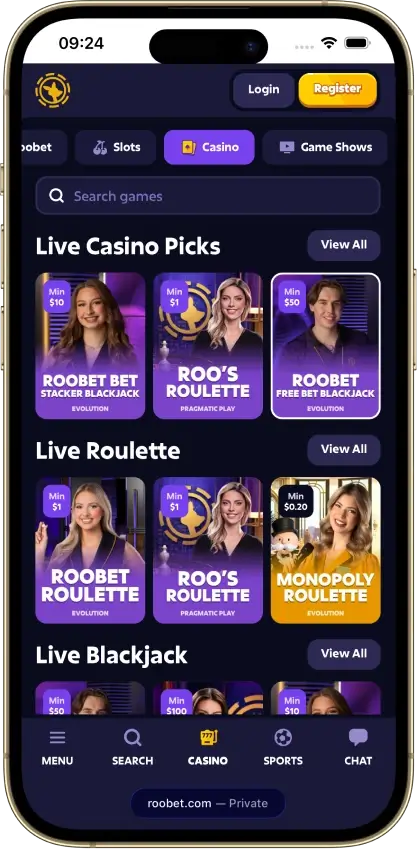
Roobet
- Bonus
- 100% first deposit up to $1,000
- Wagering
- 30x deposit + bonus
- Payout
- Crypto: near-instant if clear
Pros
- Instant rakeback claimable every 30 minutes
- $100,000 weekly raffle, 100 winners
- Rakeback lands as cash, never bonus funds
- 31 ranks, with every threshold listed
- Crypto cashouts often land in 15 minutes
Cons
- No rakeback rates listed per rank
- Support can feel scripted on disputes
- 30x wagering on deposit plus bonus
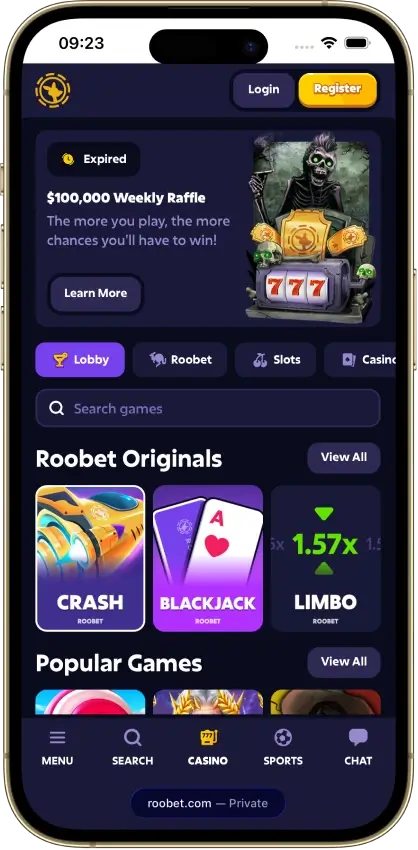
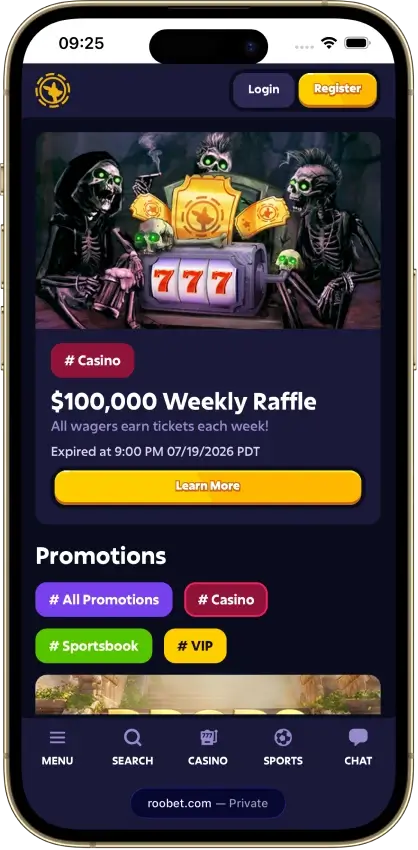

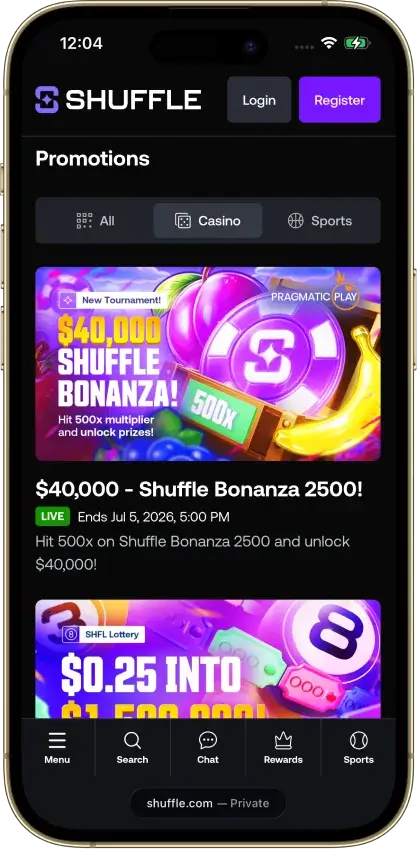
Shuffle
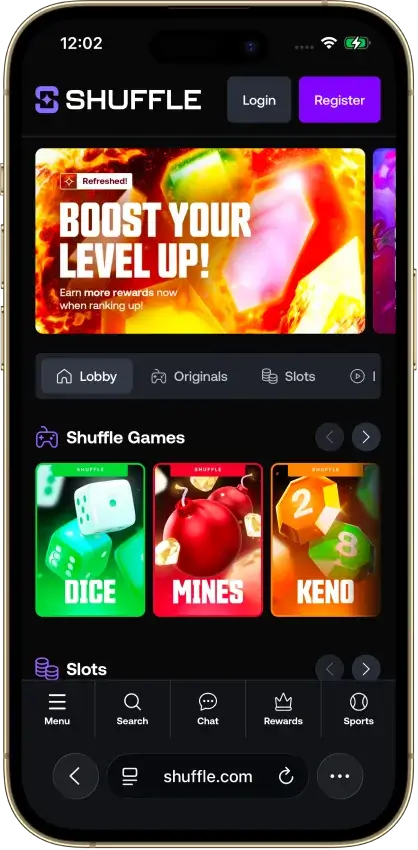
- Bonus
- 100% up to $1,000; $20 min
- Wagering
- 35x deposit + bonus
- Payout
- Crypto: mins if no review
Pros
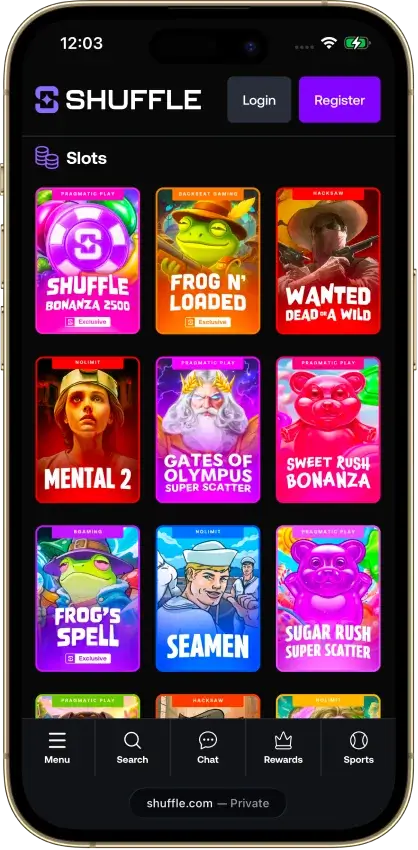
- Clean, fast lobby with working search
- Rakeback and reloads with no wagering
- Withdrawal fees shown before you confirm
- Rewards paid on a clear, public schedule
- Dedicated VIP host from Sapphire rank
Cons
- 2025 vendor breach hit most users
- Welcome match takes about 70x the bonus to clear
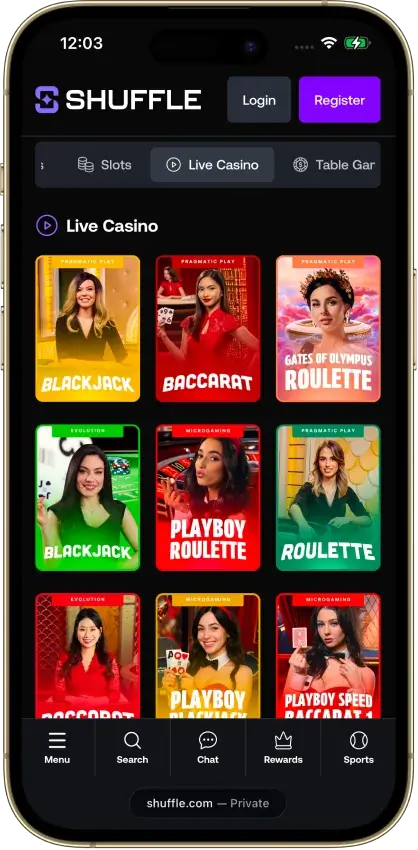
- Live casino tops out at 83 games
Stake
- Bonus
- 200% up to $2,000; Level 2 KYC
- Wagering
- 40x deposit + bonus
- Payout
- 0–2 days; KYC may extend
Pros
- $75,000 weekly raffle with 15 winners
- No maximum cashout on bonus winnings
- No stated maximum crypto withdrawal limit
- Its own poker room in the same account
- Live chat replies in about 2 minutes
Cons
- Bets limited to 1% of your deposit while wagering
- Terms allow Stake to adjust slot RTPs
- Many games excluded from bonus wagering
7Bit Casino
Pros
- Games from 100+ studios
- Crypto payouts near-instant once approved
- Live tables from Evolution and Playtech
- On-ramp for card, Apple Pay, SEPA
- Points-based VIP, status never resets
Cons
- Low max-bet while wagering is active
- Weekly withdrawals limited to $10,000
- USDT on ERC-20 only, XRP needs a tag
- Welcome spin wins limited to $100


Each listing shows the casino's CryptoSlate score, a short summary, and its main pros and cons. The scores come from the full casino reviews and follow how we score crypto casinos. View Promo Code opens that casino's claim steps, its wagering worked through, and its offers for existing players. Visit Website goes straight to the casino through a tracked link.
Why Many Crypto Casino Bonuses Need No Code
What a Promo Code Tells the Casino
A crypto casino pays the site that referred each player, either as a share of what the casino earns from that player or as a one-off payment for a first deposit. Paying the right site means knowing where every account came from. A promo code typed at registration was the simplest record of that. Each referring site got its own code, and entering it gave the player the deal that site had agreed with the casino.
Some codes contain a website's name and work at several unrelated casinos. Typing one of those tells each casino which website referred the player.
What a Tracked Link Does
A tracked link records the same referral with nothing to type. The click passes a referral ID to the casino, which stores it in a browser cookie or on its own servers and ties it to the account at registration. The deal the referring site arranged is linked to the account from that point, so the welcome bonus promised on that site is the one the new account is eligible for. Claiming it can still take a step, such as a qualifying deposit or a request to support.
When You Still Need a Promo Code
The link works only if the casino receives that referral ID. Registering in a different browser or on another device can drop it, and so can clearing cookies before signing up. A code is the backup where the casino offers one.
Some exclusive deals and no-deposit free spins ask for a code at sign-up even after a tracked click. Casinos also post bonus drop codes on their social media accounts for existing players, and a referral code from another player links a new account to that player. Enter a deposit bonus code before you deposit unless the casino's terms say otherwise.
How We Source and Label Each Promo Code
Every bonus figure on a casino's promo code breakdown comes from that casino's own bonus terms and help pages. That covers the match percentage, the cap, the minimum deposit, the maximum bet while wagering, and the expiry. Wagering is stated as bonus only or deposit plus bonus, whichever the casino applies, and converted into the total a player has to bet before withdrawing.
A casino gets the “No code required” label only when its own terms show the welcome bonus crediting without one. Exclusive means the casino issued the code for CryptoSlate players alone, so a code shared by several sites never gets that label.
Crypto Casino Bonuses Beyond Promo Codes
Most rakeback and cashback programs need no code. They pay back a share of each bet or loss on a schedule the casino sets. For someone who plays every week, that money back can add up to more than a one-time match, so compare what a month of it returns with what a crypto casino welcome bonus is worth after its wagering. Rates and caps differ between cashback crypto casinos.
Over months of play, payout speed and licensing affect a player more than any single code. They are also the two largest parts of the score behind the top-rated crypto casinos.