Explore WhiteBIT’s Institutional Playbook, a 3-part guide series on exchange due diligence, crypto-as-a-service, and token listing strategy for institutional teams.
This article was published 3 years ago. Some details may no longer reflect current market conditions or recent developments.If you spot anything that needs an update, contact us.
Cover art/illustration via CryptoSlate. Image includes combined content which may include the use of AI tools.
Monitoring unrealized profit and loss is a cornerstone of market analysis. While realized profit and loss offer a snapshot of the market's past behavior, unrealized profit, and loss provide a window into the market's potential trajectory. This distinction becomes even more pronounced when we zero in on short-term holders.
Short-term holders, defined as entities holding Bitcoin (BTC) for less than 155 days, play a pivotal role in shaping the market dynamics. Their behavior, driven by recent market trends and short-term goals, profoundly influences Bitcoin's price. Conversely, price movements can also sway their decisions, creating a feedback loop that stabilizes or destabilizes the market.
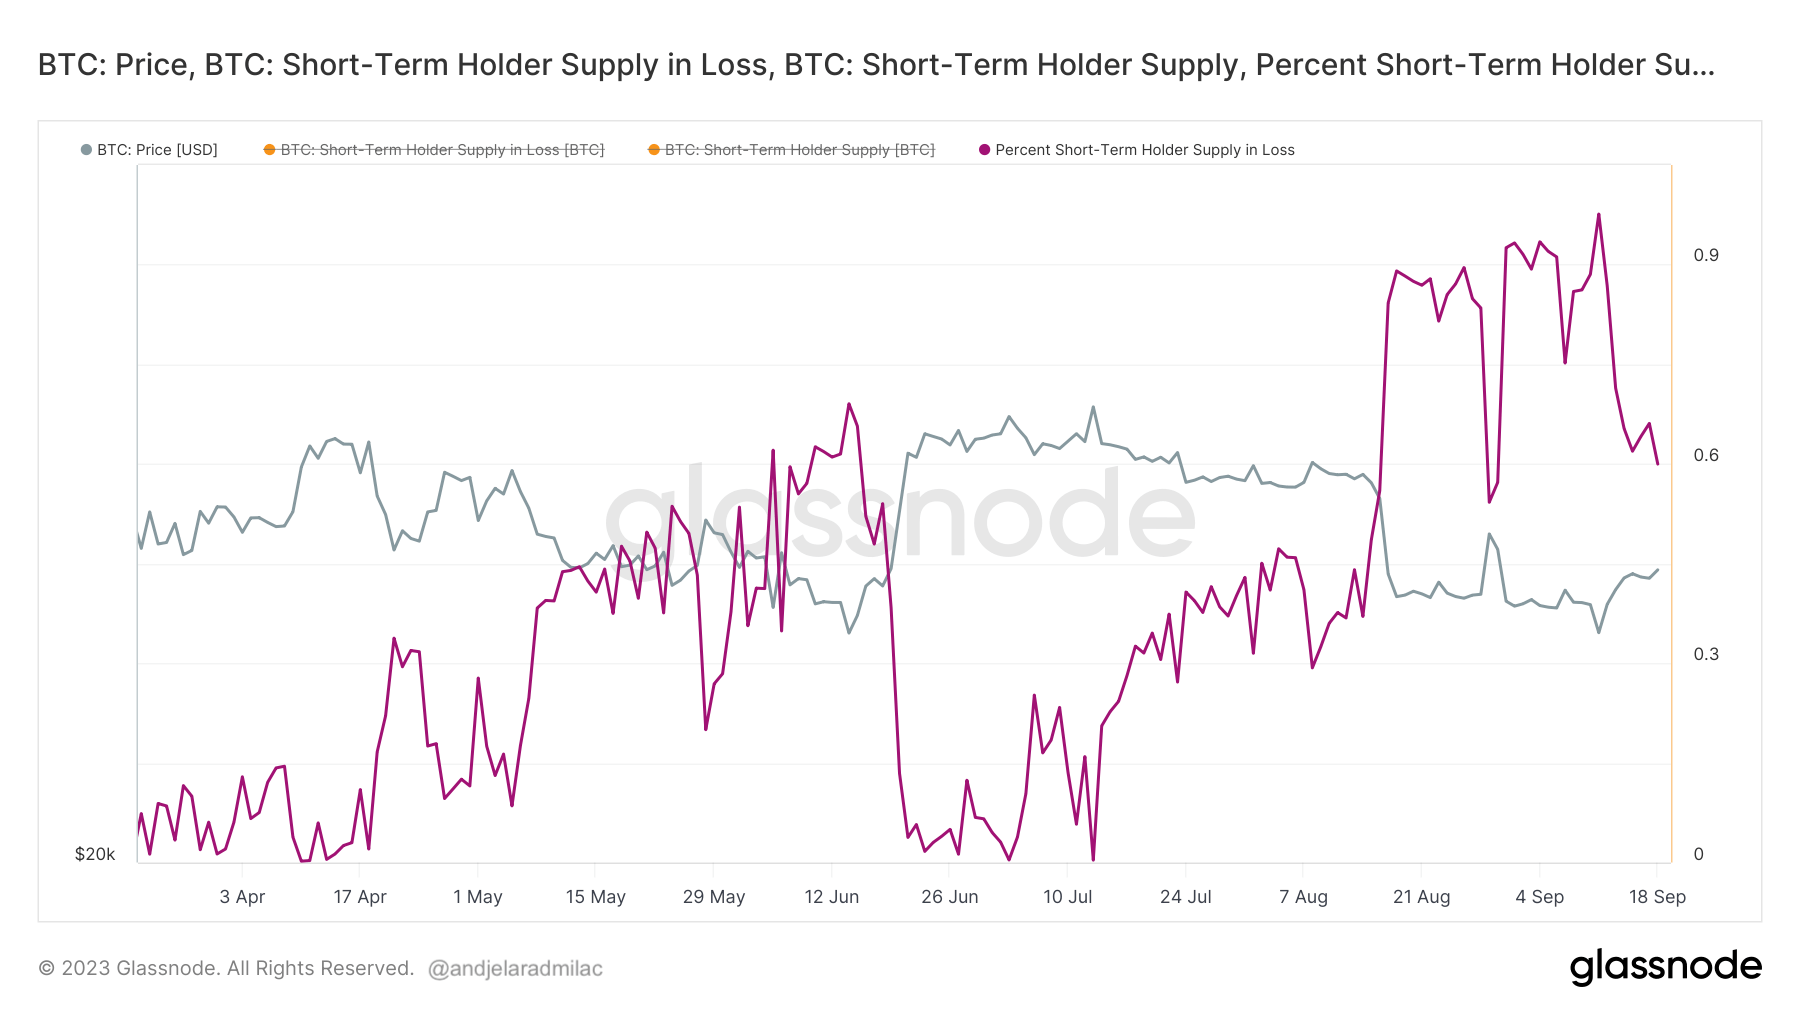
Recent data from Glassnode sheds light on the state of short-term holders. Following Bitcoin's brief dip to $25,000 on Sep. 11, the percentage of short-term holder supply in loss rose to 97.61%. Bitcoin's recovery to $27,000 reduced the supply loss to 59%. On Sep. 19.
Graph showing the percent of short-term holder supply in loss from March 22 to Sep. 19, 2023 (Source: Glassnode)
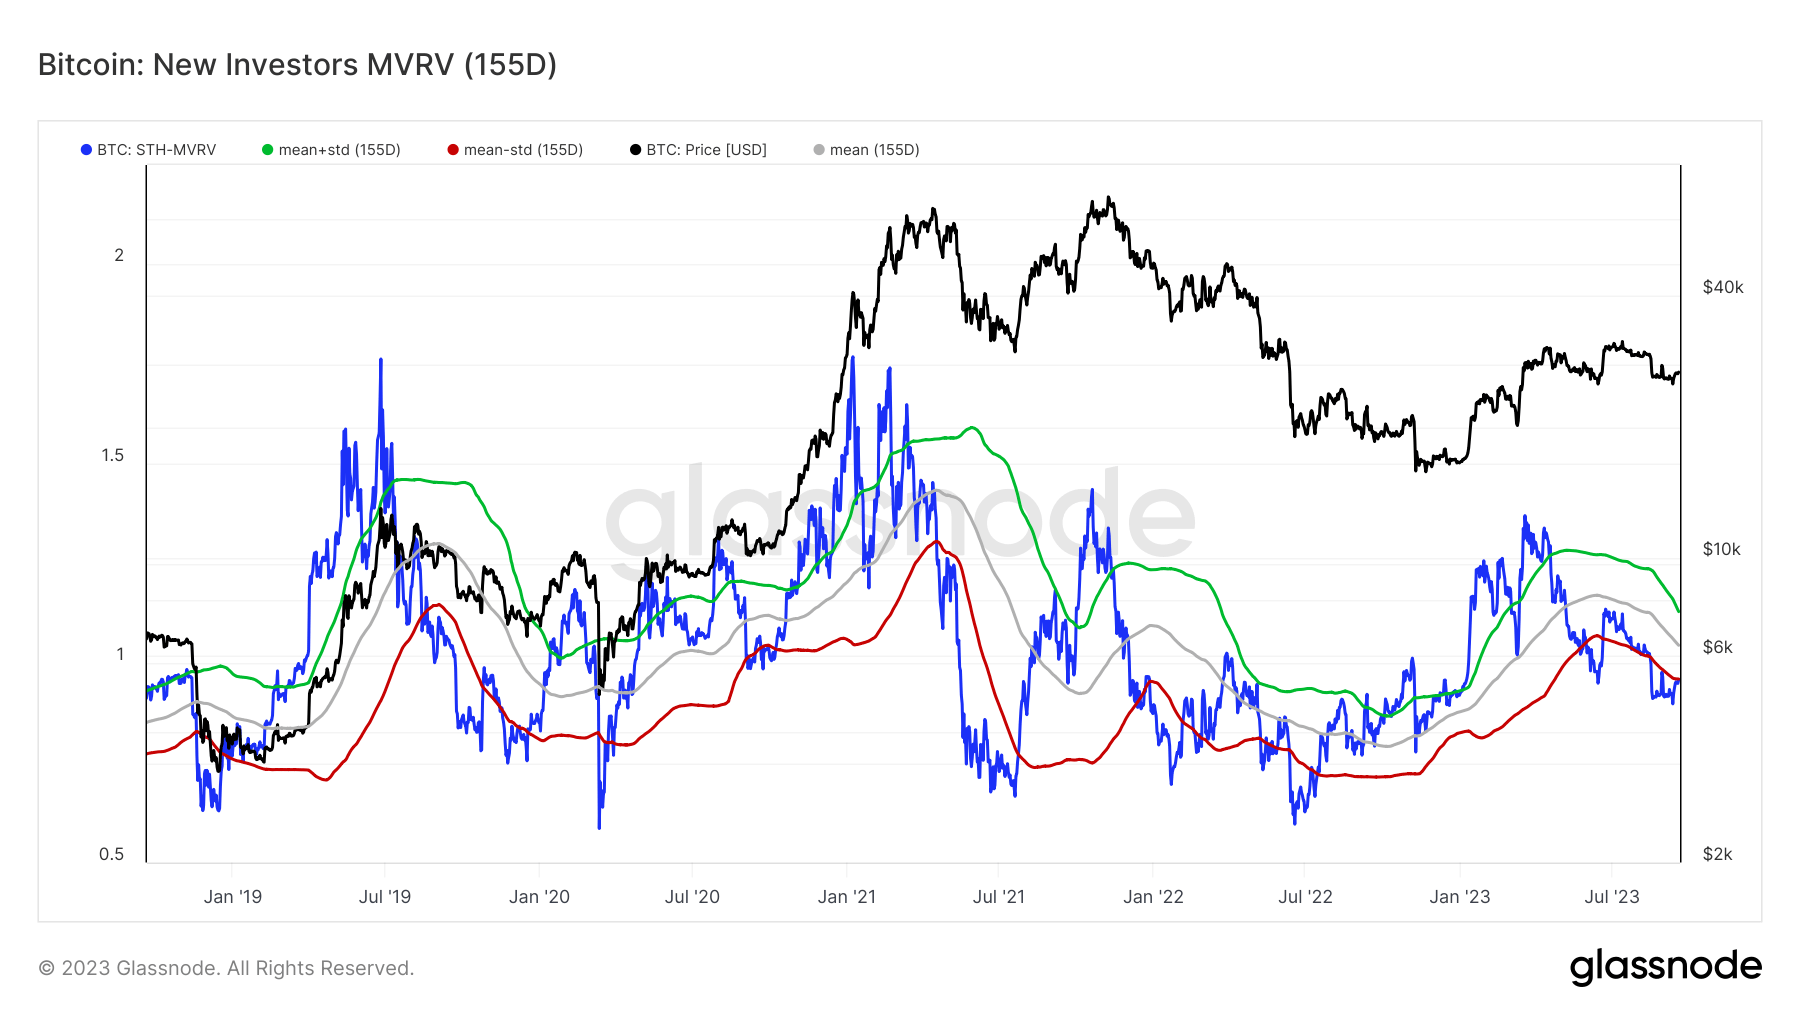
The MVRV ratio shows short-term holders' unrealized profit or loss relative to the asset's market value.
By juxtaposing the extremes in STH-MVRV against its 155-day average, we can create upper and lower bands for the indicator. The upper band represents the mean plus one standard deviation, while the lower band is the mean minus one standard deviation.
CryptoSlate Daily Brief
Daily signals, zero noise.
Market-moving headlines and context delivered every morning in one tight read.
5-minute digest 100k+ readers
Free. No spam. Unsubscribe any time.
Whoops, looks like there was a problem. Please try again.
You’re subscribed. Welcome aboard.
These bands show that many of the market's highs and lows correlated with significant deviations outside these boundaries. This indicates that recent investors were either reaping substantial profits or nursing significant losses during these periods.
Graph showing the STH-MVRV ratio from Sep. 2018 to Sep. 2023. Note that market tops and market bottoms correlate with extreme deviations of the STH-MVRV ratio (Source: Glassnode)
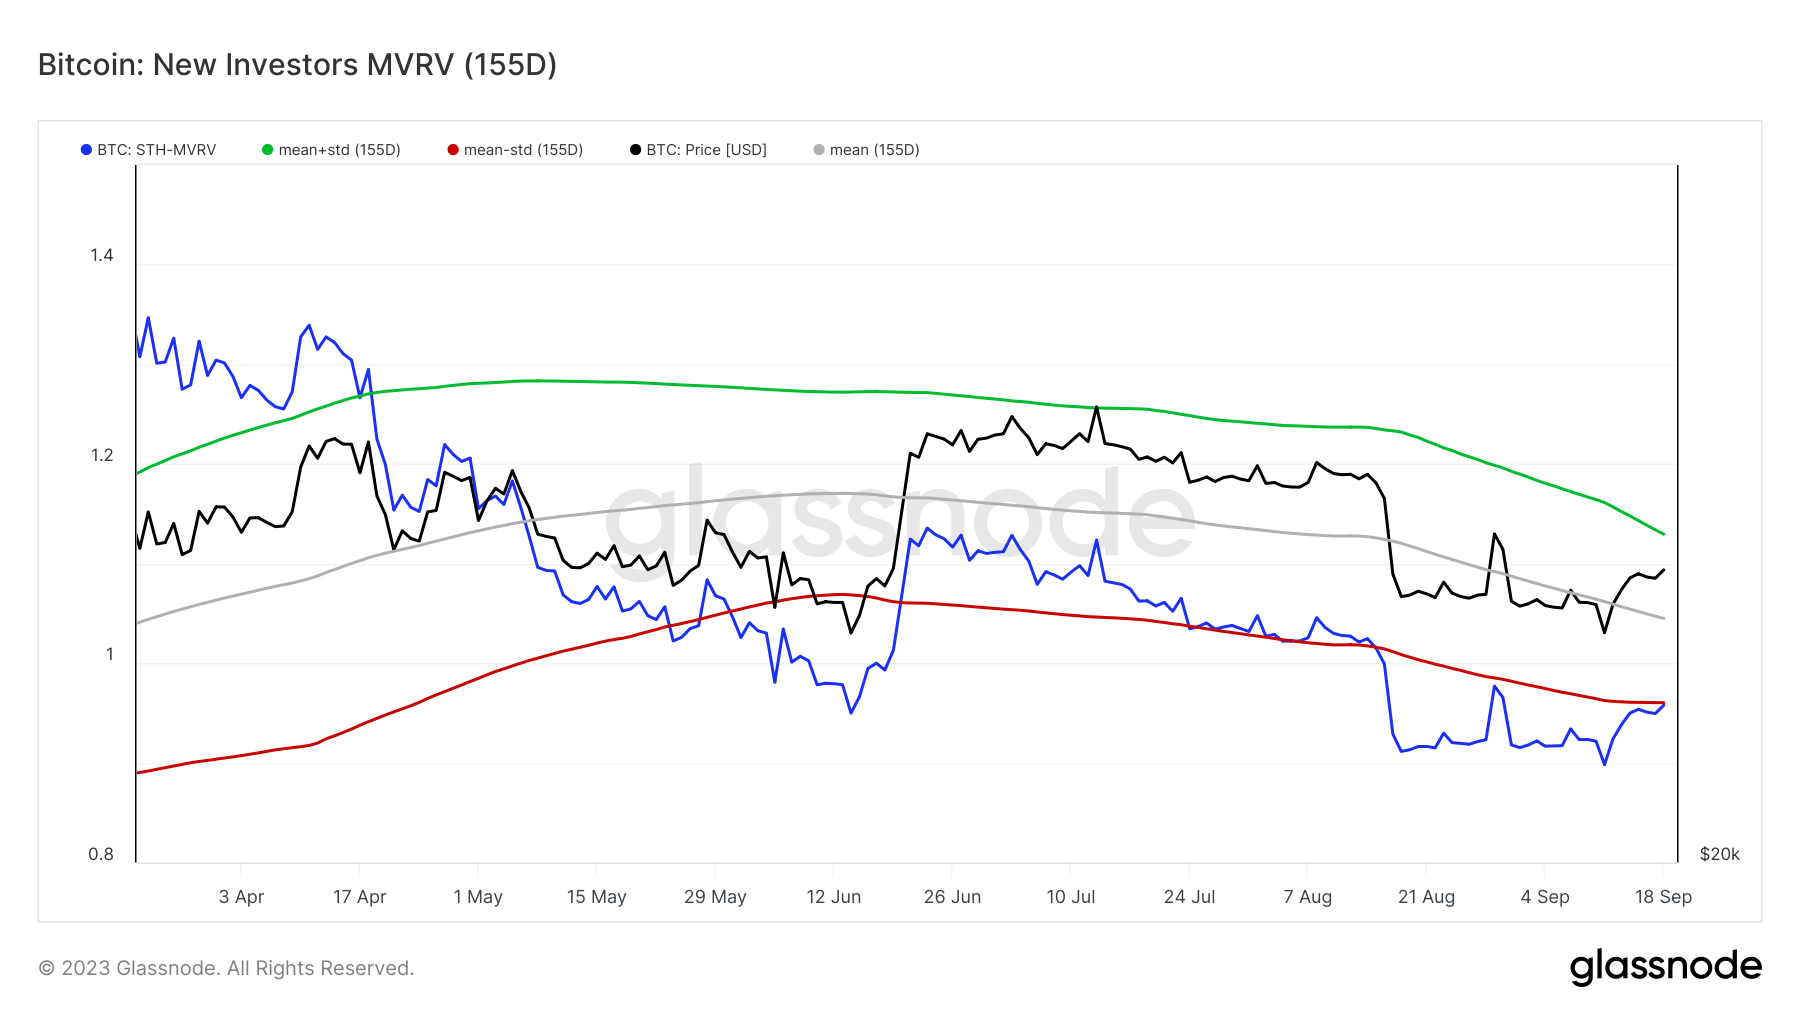
As of Sep. 11, the STH-MVRV ratio hovers at 0.95, brushing against the lower band. It's worth noting that the STH-MVRV dipped below this lower threshold on Aug. 15, coinciding with Bitcoin's price slide from $29,000 to $26,000. The ratio has remained below this band since then.
Graph showing the STH-MVRV ratio from March 22 to Sep. 22, 2023 (Source: Glassnode)
The current position of the STH-MVRV ratio, coupled with the percentage of short-term holder supply in loss, suggests a heightened state of seller exhaustion. In the context of Bitcoin's price, seller exhaustion implies that the selling pressure starts to wane as most short-term holders who want to sell have already done so. Historically, such scenarios have often paved the way for price recoveries as selling pressures diminish.