What is NFT wash trading? Examples of how it works
There is an underlying assumption that the entire NFT market is fraudulent in nature and only consists of wash traders. We often see media headlines pushing this narrative. After all, why would people spend millions of dollars on a JPEG?

Cover art/illustration via CryptoSlate. Image includes combined content which may include the use of AI tools.
Dec 2022, CoinGecko and Footprint Analytics Joint Report
 There is an underlying assumption that the entire NFT market is fraudulent and only consists of wash traders. Unfortunately, we often see media headlines pushing this narrative. After all, why would people spend millions of dollars on a JPEG?
Wash trading is a trader buying and selling the same asset repeatedly to manipulate the trading volumes and the price of an asset. Parties involved may consist of a single entity or a collusion of entities. It is illegal in traditional capital markets to wash trade, as the intent is often to mislead other buyers/sellers that the asset is worth a lot more than it is and that there is an artificially liquid market.
Crypto, specifically NFTs, does not have strict regulations, and wash trading can sometimes be rampant. In addition to the reasons stated above for wash trading, two other reasons are unique to NFTs: tax loss harvesting and earning token rewards.
Wash Trading For Price/Liquidity Manipulation
Attention is everything for NFTs. In a space where collections live and die by the hour, founders will do whatever they can to attract eyeballs and create momentum. The easiest way to garner attention is by appearing on the front page of NFT marketplaces. OpenSea, LooksRare, Magic Eden, etc., all have a landing page that showcases trending collections.
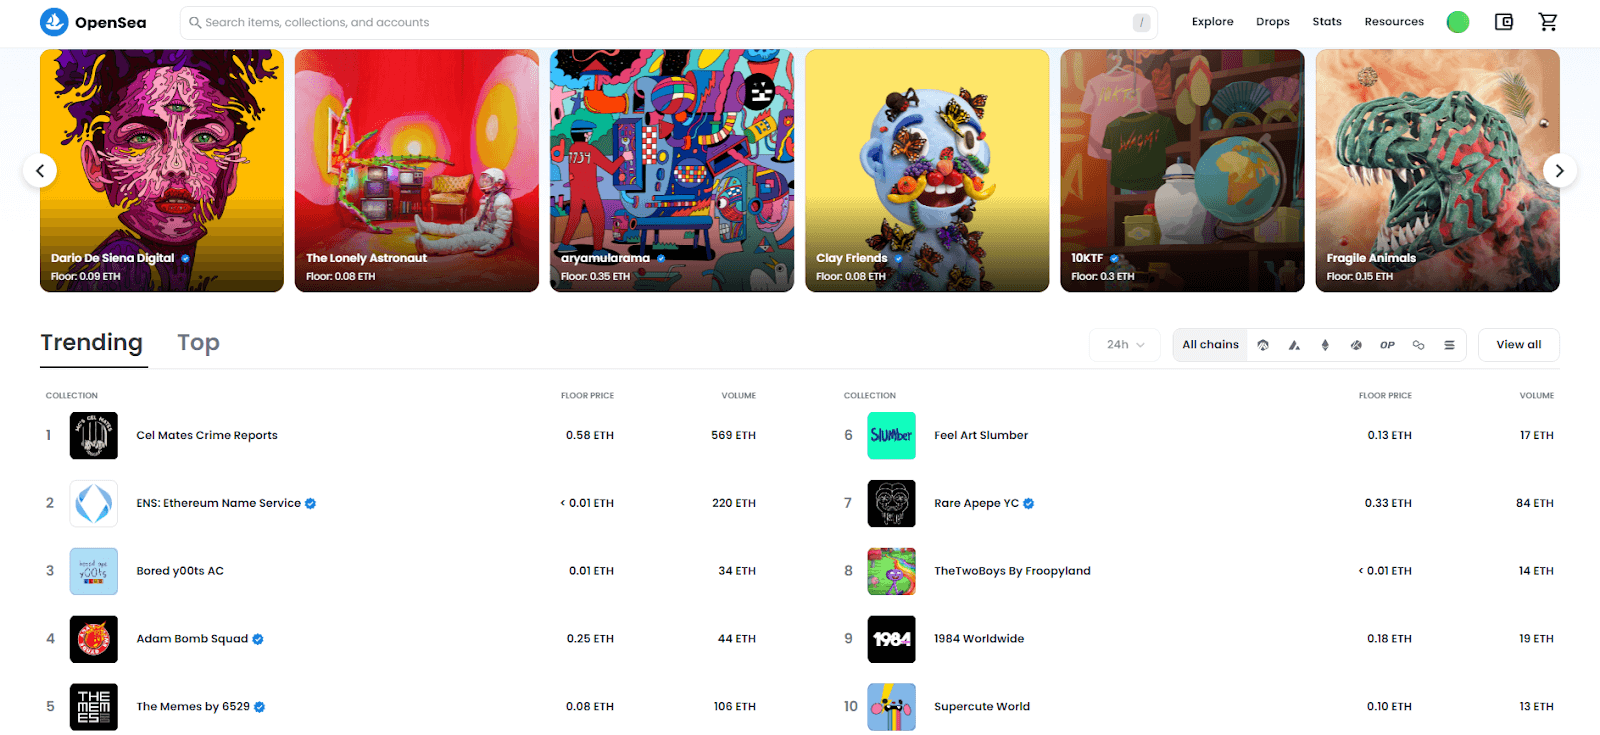
While none of the marketplaces are explicit about how their trending algorithms operate, it is clear that trading volumes are a significant factor for inclusion on the Trending Collections list. This incentivizes NFT collection founders to wash trade to pump their trading volume numbers, thereby increasing the chance of their collections being listed on Trending.
Unfortunately, wash trading also gives a false impression of liquidity, generating false confidence that there is demand and hype surrounding their NFTs. Inevitably, this may entice unsuspecting buyers into buying their NFTs at an inflated price.
One example that we have identified is PixBattle #1, a gaming project who stylized itself as the first pixel game on Solana.
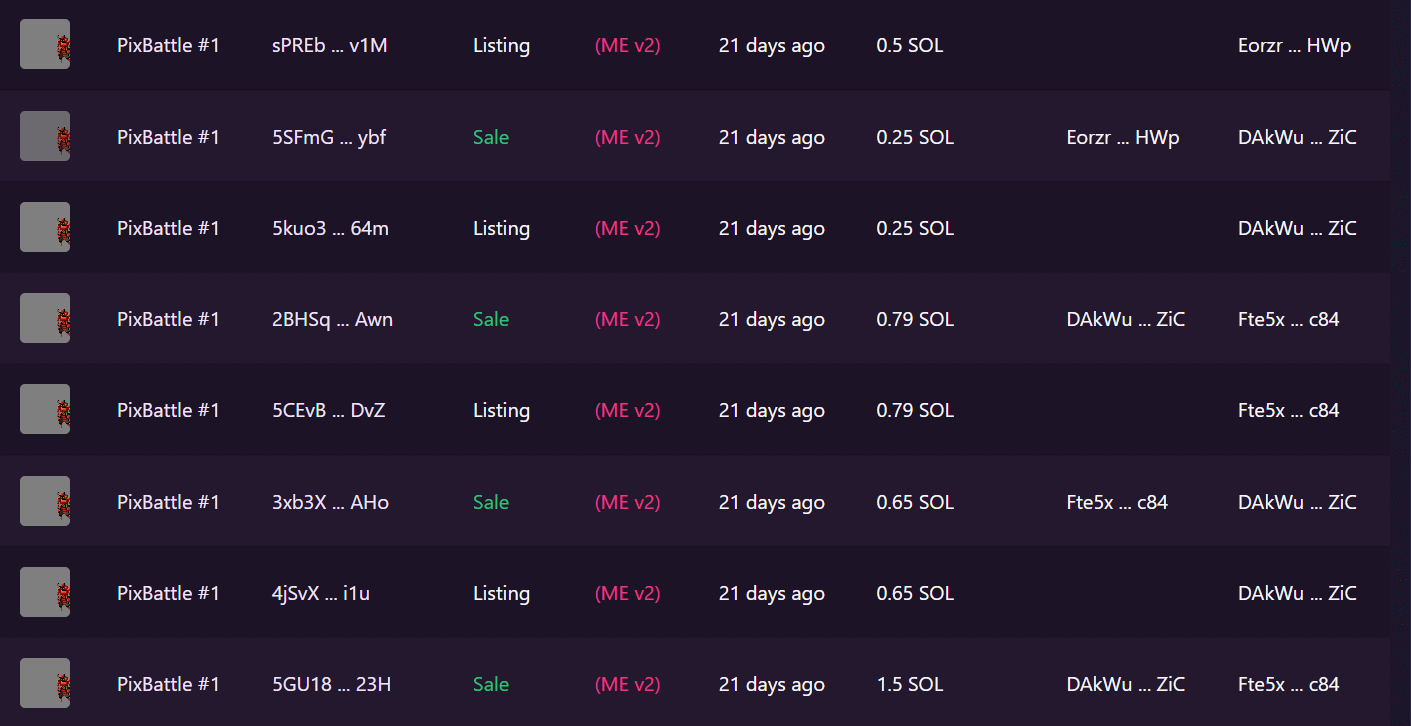
The screenshot above shows that a single NFT was repeatedly traded between two addresses over a day. There is no reason for this to occur other than to falsify trading volume and interest. The trader also didn't bother to try too hard to hide their tracks by repeatedly using the same two addresses. Moreover, using the NFT with the #1 ID (thereby indicating it was minted first) raises the likelihood that the trader was probably a founder of the collection who knew firsthand when it would be launched.
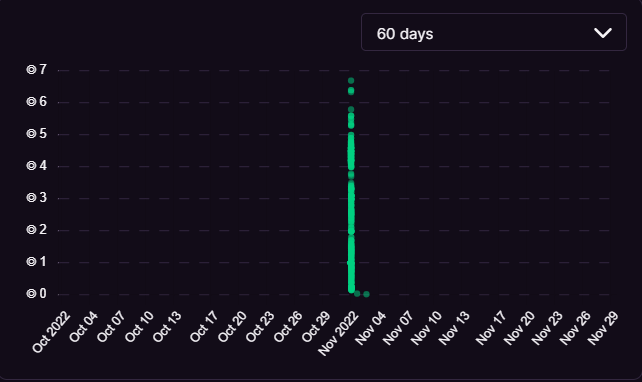
If we look at the chart on Magic Eden, we can see some unwitting suspects buying the top before liquidity dried up overnight and the collection went to 0.
Identifying Wash Trades
While it is close to impossible to identify all collections that carry out wash trading as it involves filtering an extensive data set based on qualitative factors, these are some common signs to look out for:
- Collection trades at a persistent price level (i.e., no outlier buys for ‘rares').
- The collection has high trading volume / is trending but has low visibility / poor social media metrics (e.g., low Twitter follower count)
- An NFT was bought more than a normal amount of times in a day (at Footprint Analytics, we estimate this to be more than 3+)
- An NFT was bought repeatedly by the same buyer address over a short period, say 120 minutes.
Wash Trading For Harvesting Tax Losses
Another reason for wash trading is for tax loss harvesting. Certain jurisdictions, such as the US and Europe, treat NFTs as capital assets and impose some form of capital gains tax. Traders pay tax on gains but can typically offset investment losses in the final tax calculation. However, this only applies when the investor has realized their gains and losses, i.e., they need to sell their assets. Under these circumstances, buyers who bought the top but are now down badly may be incentivized to sell their NFTs at a loss to offset gains they may have made in other capital assets.
Technically, tax-loss harvesting is neither uncommon nor is it an illegal phenomenon. However, because of the ease with which NFTs can be wash traded, we believe this warrants a mention.
It is easy to sell an NFT to another wallet that you control ‘at a loss' on an NFT marketplace. Setting the price at a nominal amount (e.g., 1 USDC) allows the user to harvest tax losses while possessing the supposed ‘disposed of' asset. Unfortunately, the lack of regulatory oversight over NFT marketplaces and the difficulty of proving tax fraud encourage this technique.
If we look at the Top 10 Collections on Ethereum, we can see that there are actors in the space who do take advantage of this. We have filtered the transactions based on sales below 90% of the floor price at the time.
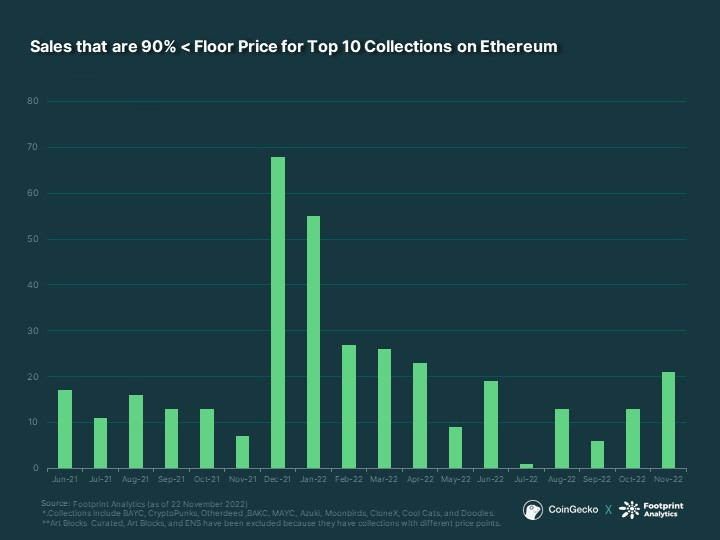
Looking at the sales pattern, the highest monthly sales occurred in December 2021, followed by January 2022. Coincidentally, this is the close of the tax reporting period for many jurisdictions. It is probably safe to assume that most (if not all) of these transactions involved some intent to harvest tax losses during this period as asset holders prepare to file their tax returns.
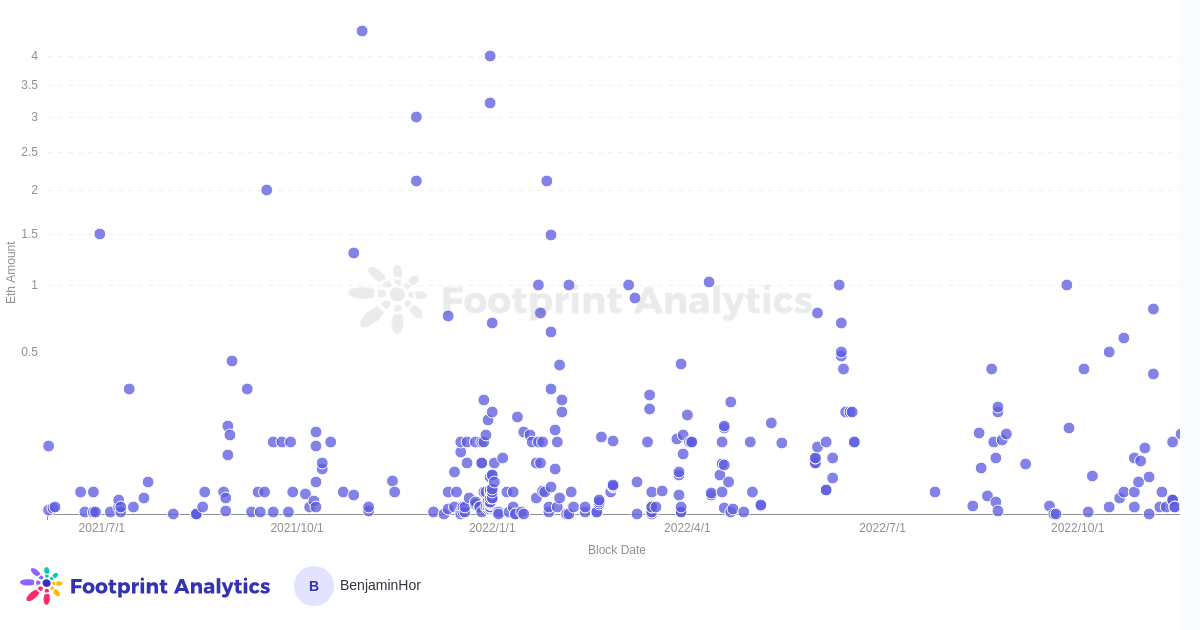
Within the Top 10 ETH Collections, the top three favorite collections for harvesting tax losses are MAYC (117), Cool Cats (74), and CloneX (61). Furthermore, wash traders under this category seem to sell at meager prices, i.e., below 0.5 ETH and most close to 0, making them obvious outliers for any on-chain observers.
Nevertheless, it is worth mentioning that there may be other reasons for having these low-priced sales, such as incorrect listing prices and selling to someone at a discount.
Wash Trading For Tokens
LooksRare and X2Y2 are the most well-known NFT marketplaces with their token. Currently, tokens are distributed to high-volume traders on their respective platforms. Wash traders take advantage of this formula and maximize their rewards by generating considerable trading volume daily through back-and-forth trading between wallets they own. To identify these types of transactions, we have filtered transactions on both LooksRare and X2Y2 according to the following formula:
- Overpriced NFT trades (10x OpenSea Average Price)
- Collections with 0% royalties (except CryptoPunks and ENS)
- An NFT bought more than a normal amount of times in a day (currently filtered for more than 3+)
- An NFT purchased by the same buyer address in a short period (presently filtered for 120 minutes)
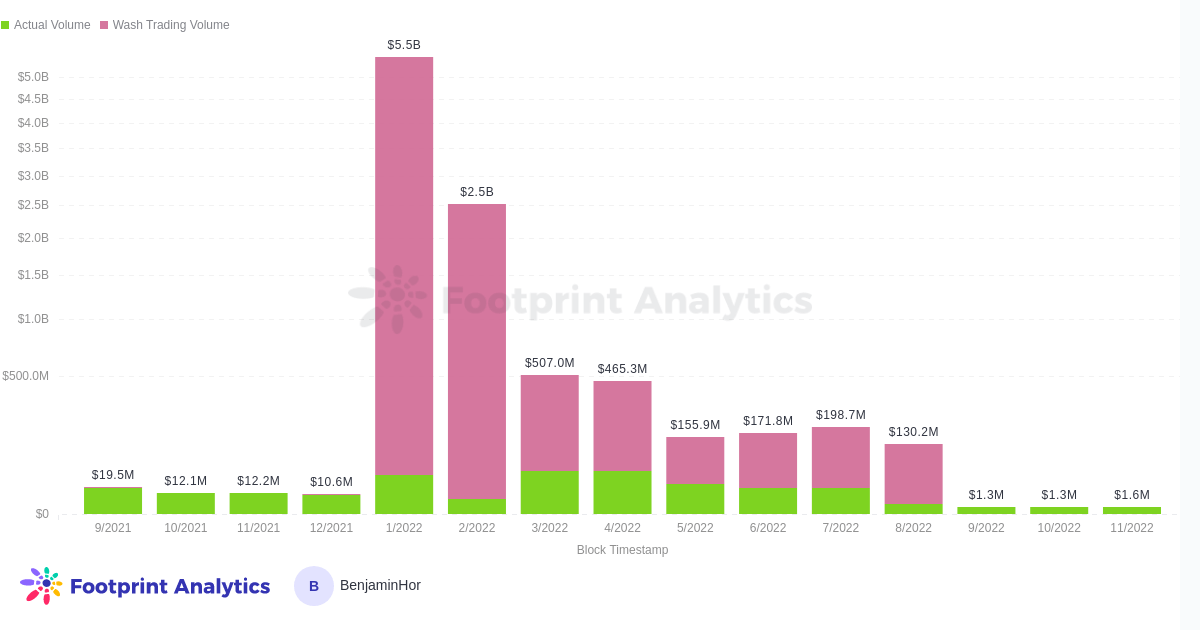
Applying these filters, it seems that more than 80% of the trading volume for these two marketplaces are wash trading transactions since launch:
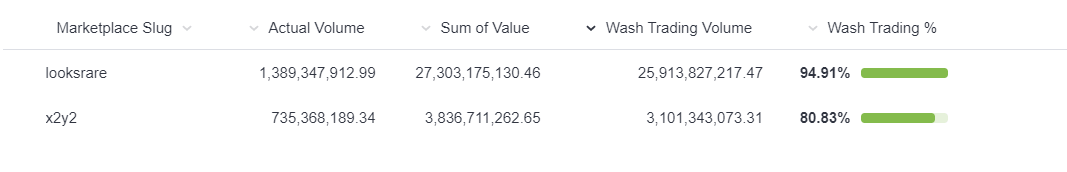
We believe LooksRare has a higher wash trading volume because its rewards are more lucrative. Therefore, we've calculated the total value of distribution rewards measured against each token's daily close price since launch. Below are the results up till 22 November 2022.
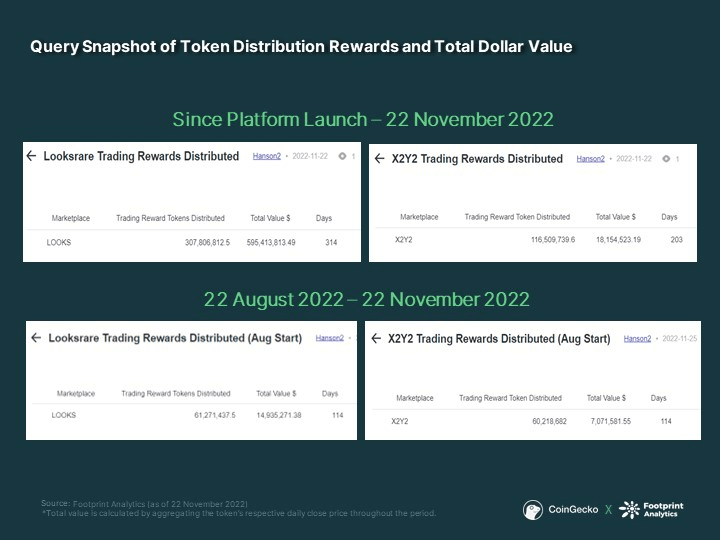
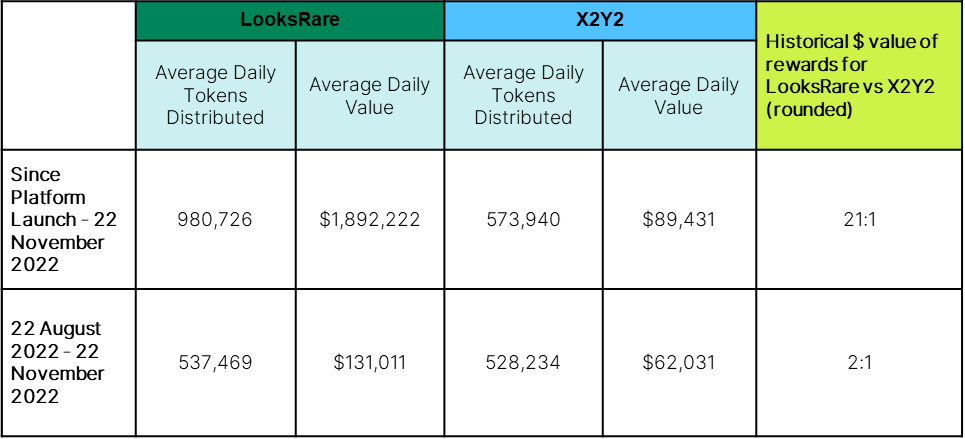
If we take the historical average, for every dollar you earn on X2Y2 from trading rewards, you would have earned twenty-one more on LooksRare. However, this number is misleading as LooksRare launched about three months before X2Y2 when the market was still exuberant, and the prices of LOOKS (LooksRare's token) were much higher. After the initial hype died down and the bear market kicked in, the trading rewards normalized to more even levels. Even so, LooksRare still offers twice as much dollar value based on the past three months.
Nevertheless, these are only broad assumptions, as the rewards are highly dependent on the percentage of the platform's respective daily trading volumes. For example, X2Y2 can have higher rewards for a particular day if the total sales volume is lower (thus giving the seller a higher % of token rewards) or if the token's price is higher.
Funnily enough, although LooksRare distributes more value on average, X2Y2 has more organic volumes. Moreover, since June 2022, X2Y2 has consistently outperformed LooksRare in monthly trading volumes (disregarding wash trading volumes).
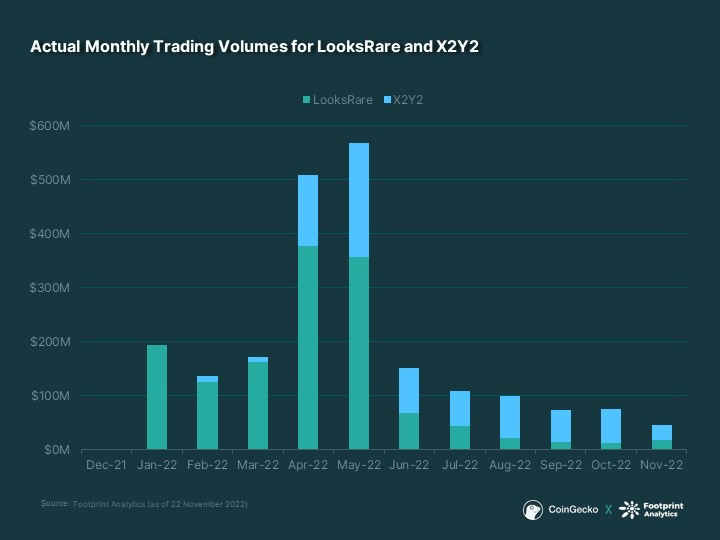
A likely explanation is the appearance of being more cost-effective. X2Y2 charges a 0.5% marketplace fee and offers optional royalties (though this feature has been retracted as of 18 November 2022), whereas LooksRare has a higher trading fee (2.0%). However, even if we factor in LooksRare's higher trading fee, it has always been cheaper to trade on LooksRare after we offset token rewards.
We can only surmise that X2Y2's marketing strategy is more effective where human psychology favors ‘discounts' over ‘cashback.' This is also despite LooksRare's average staking rewards being higher for its token (53.61%) than X2Y2's (38.81%) as of 22 November 2022.
Trading Demographics and Patterns
Because of the prevalence of this wash trading method, we thought it would be interesting to dive a little deeper into the trading patterns of LooksRare / X2Y2 wash traders.
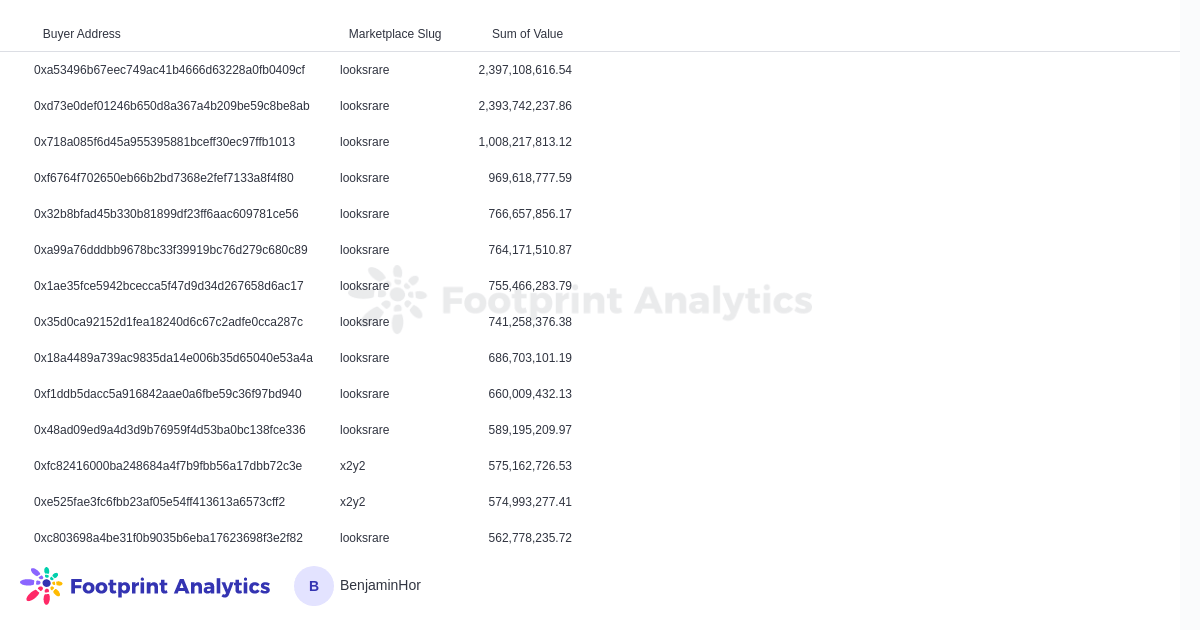
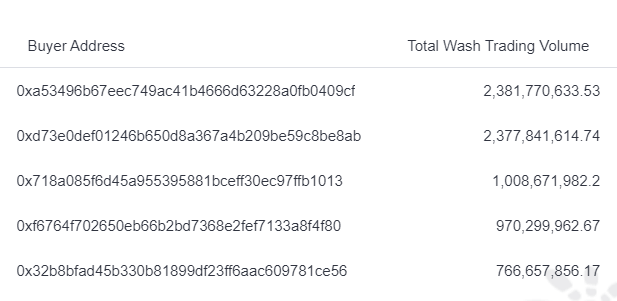
We have identified over 6442 addresses that wash trade on LooksRare and X2Y2. The Top 10 addresses are all from LooksRare, which aligns with the premise that there is better value extraction from the token rewards.
These traders have two distinct trading times, spiking at 8 AM-9 AM (UTC+0) and towards the end of the day.
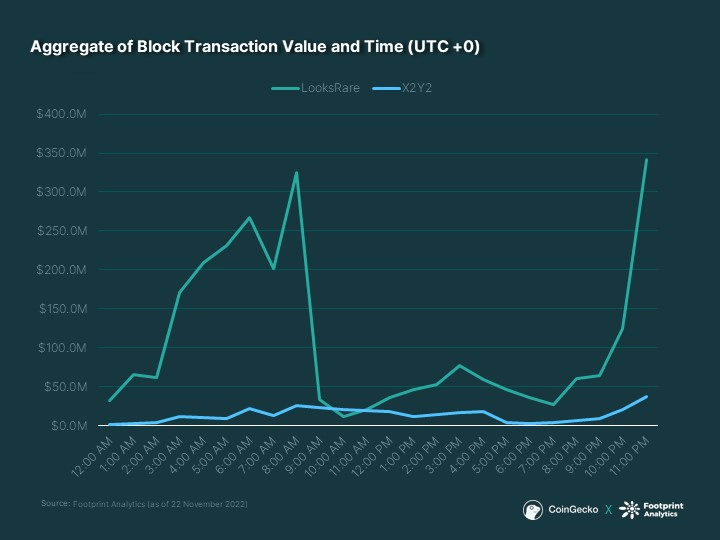
Ethereum uses a Unix timestamp, i.e., UTC. Therefore, trading right before the day closes makes sense because they are probably trying to increase their daily volume share on the marketplace. Since trading rewards are based on % of the marketplace's daily total volume, it is better to wash trade as late as possible to determine the amount of firepower/effort needed to command a sizeable share of rewards.
As for the spike in the morning, we speculate that these traders operate in timezones that are close to midnight for them, which coincides with late evenings for the US.
In terms of the most popular collection for wash trading, Terraform by Mathcastles takes the top spot. Over $12B have been wash traded, representing 99.82% of the collection's collective trading volumes on LooksRare and X2Y2.
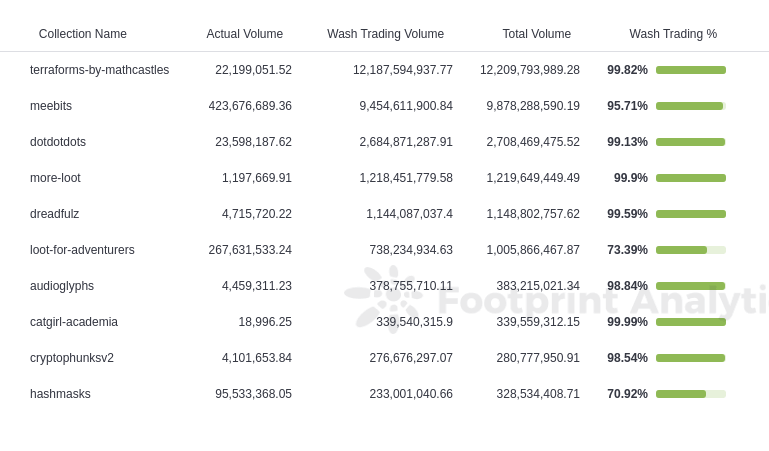
We are not sure why this is the case. The only thing in common between all these collections is that they have zero royalties (except Meebits), which means it costs less to wash trade. We can only assume that a whale or a pod of whales have designated it as their preferred wash trading collection. Indeed, if we look at the list of wash traders for Terraform, the top 2 wallets have traded close to $4.8B alone.
Most likely, this is a single whale trading between their wallets, contributing over 1/3rd of wash trading volumes for the collection alone.
Before Terraform took over, it is worth noting that Meebits was the favorite for wash traders after LooksRare launched until they implemented royalties in September 2022. Wash trading volumes subsequently died overnight.
Conclusion
Without proper regulatory oversight and enforcement, NFT wash trading is an unavoidable phenomenon on NFT marketplaces. Traditionally, manipulating prices/volumes and fraudulently harvesting tax losses are illegal, and that standard is likely to hold for crypto. Wash trading to farm token rewards, on the other hand, is a new type of activity unique to crypto.
While the primary victims at risk are the marketplaces themselves, unsuspecting users may also be harmed during this activity. Although there are ethical concerns, crypto natives would argue that code is the law. If the NFT marketplaces have not imposed any limitations on reward distributions, why shouldn't users take advantage of this bug feature?
With all this in mind, it is no wonder that everyone thinks NFTs are a scam. However, if we look at the total wash trading volumes on ETH, the picture is not very pretty.
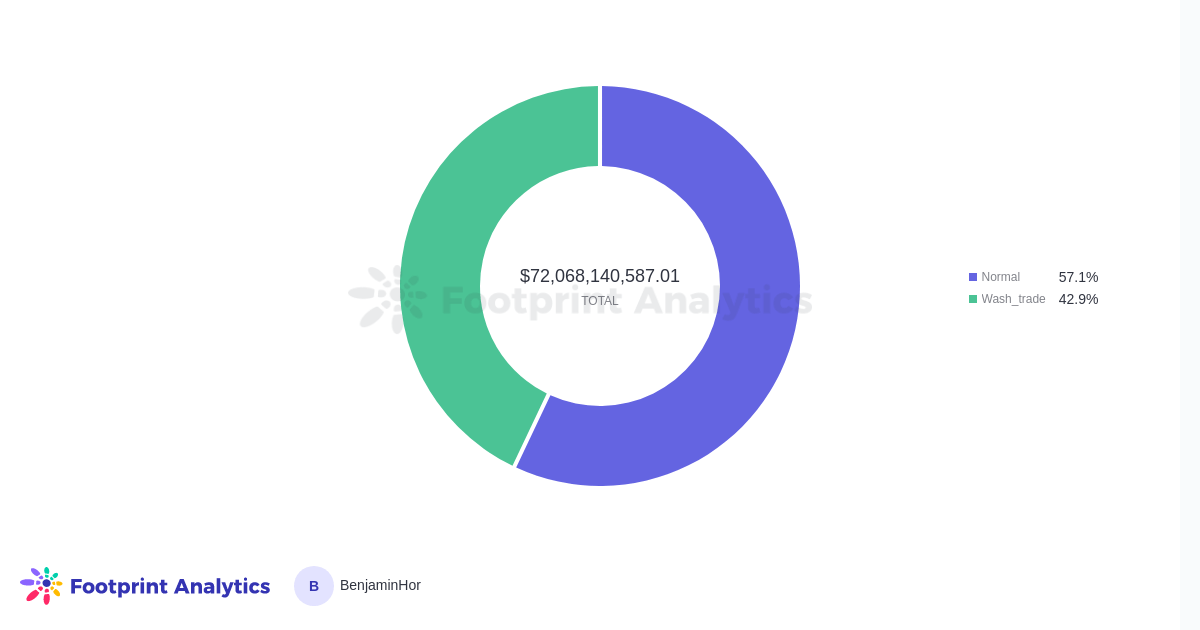
42.9% of all volumes are wash trading volumes. The sensationalist interpretation is that almost half the market is a scam; however, a more reasonable inference is that platforms like LooksRare and X2Y2 have propped up the market with fake volumes. Further, this does not change the fact that there are genuine buyers. Indeed, if we measure the market using a different metric, i.e., number of transactions, a very different picture emerges.
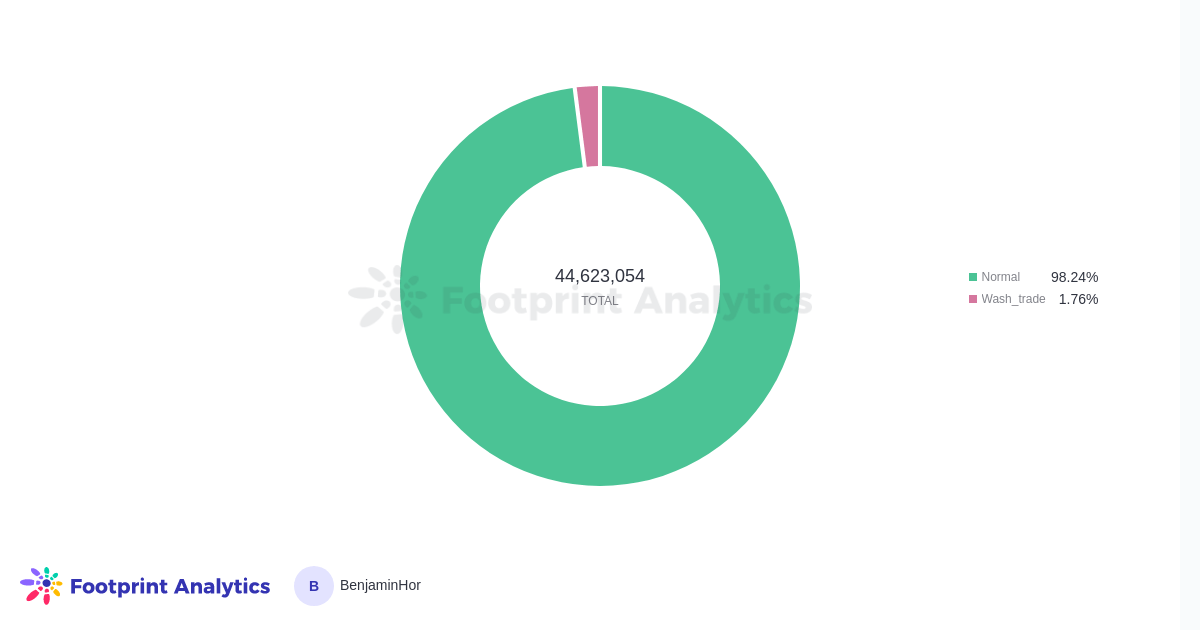
Over 98% of total transactions have been identified as genuine. In other words, it is possible that people just like JPEGs. A study on OpenSea NFTs by a group of researchers also supports this thesis with a different methodology.
Rather than being a wash trading haven, the image and reputation of the NFT industry are heavily distorted by whales and savvy degens. Of course, there are limitations to this methodology, and we cannot account for every wash trading transaction out there. Nonetheless, this is a more accurate representation of the NFT market.
But this does not mean we should take things for granted. Blockchain technology makes every transaction transparent, making it easier to identify wash trading and, thus, protect ourselves.
The first line of defense is education. NFT traders should learn to identify wash trading patterns before aping into lesser-known collections. Even then, some of the most popular collections, e.g., Meebits, may not be immune to this activity. However, we can also expect wash traders to become increasingly sophisticated and cover their tracks. Efforts to improve on-chain analysis and use platforms like Footprint Analytics would help users cut through the noise but help users make better trading decisions.
Marketplaces should also play a more active role in discouraging wash trading, as it harms actual users and themselves if someone is actively farming their native tokens.
This article was written in collaboration with Footprint Analytics. Footprint Analytics is building blockchain's most comprehensive data analysis infrastructure with tools and API to help developers, analysts, and investors get unrivaled GameFi, DeFi, and NFT insights.
The engine indexes clean and abstracts data from 20+ chains and counting—letting users build charts and dashboards without code using a drag-and-drop interface as well as with SQL.