OpenSea’s dominance shrank 23% in 2022
The marketplace is at 33% dominance as its NFT transfer count falls by 25% in 2022.
Cover art/illustration via CryptoSlate. Image includes combined content which may include the use of AI tools.
CryptoSlate looked into Glassnode data to evaluate OpenSea's performance in 2022 and revealed that the marketplace's dominance fell to 33% from 50% in January.
At the beginning of the year, OpenSea corresponded to 20% of the total Ethereum (ETH) gas usage. This percentage declined throughout the year to see 9%. The marketplace's NFT transfer count also recorded a 25% decrease in 2022.
NFT transactions by share
The chart below represents the number of transactions in the Ethereum network in relation to the transactions that interact with NFTs by calculating a share percentage.
This metric includes both ERC721 and ERC1155 token contract standards that transacted on major NFT marketplaces — OpenSea, LooksRare, Rarible, and SuperRare. The data starts from the beginning of the year and represents the shares of each NFT marketplace with a specific color.
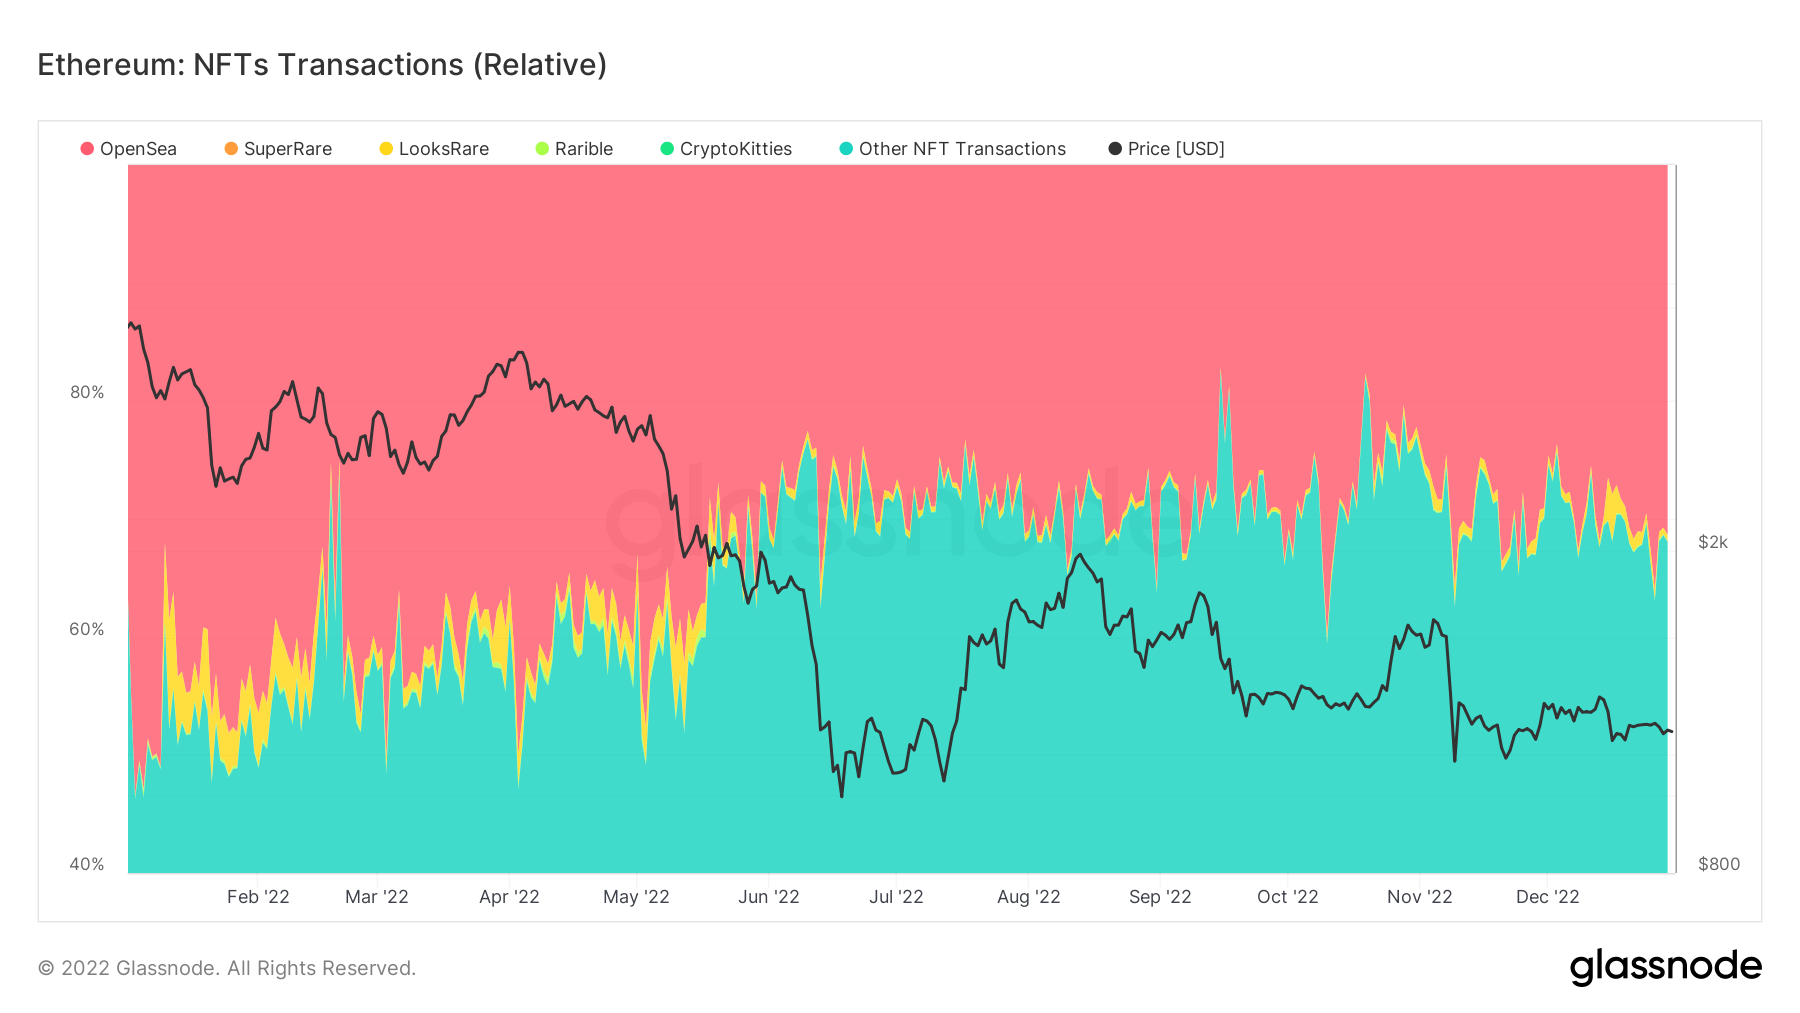
The pink areas represent the leading NFT marketplace OpenSea. It can be seen that OpenSea started the year at around 50% market dominance. However, the marketplace's dominance started to diminish at the end of May, and it ended the year at around 33%.
NFT transfer count
The NFT transfer count on marketplaces represents the number of NFT transfers facilitated by being paid with ETH or Wrapped Ethereum (wETH). This metric only includes data from OpenSea and LooksRare, starting from the beginning of the year.
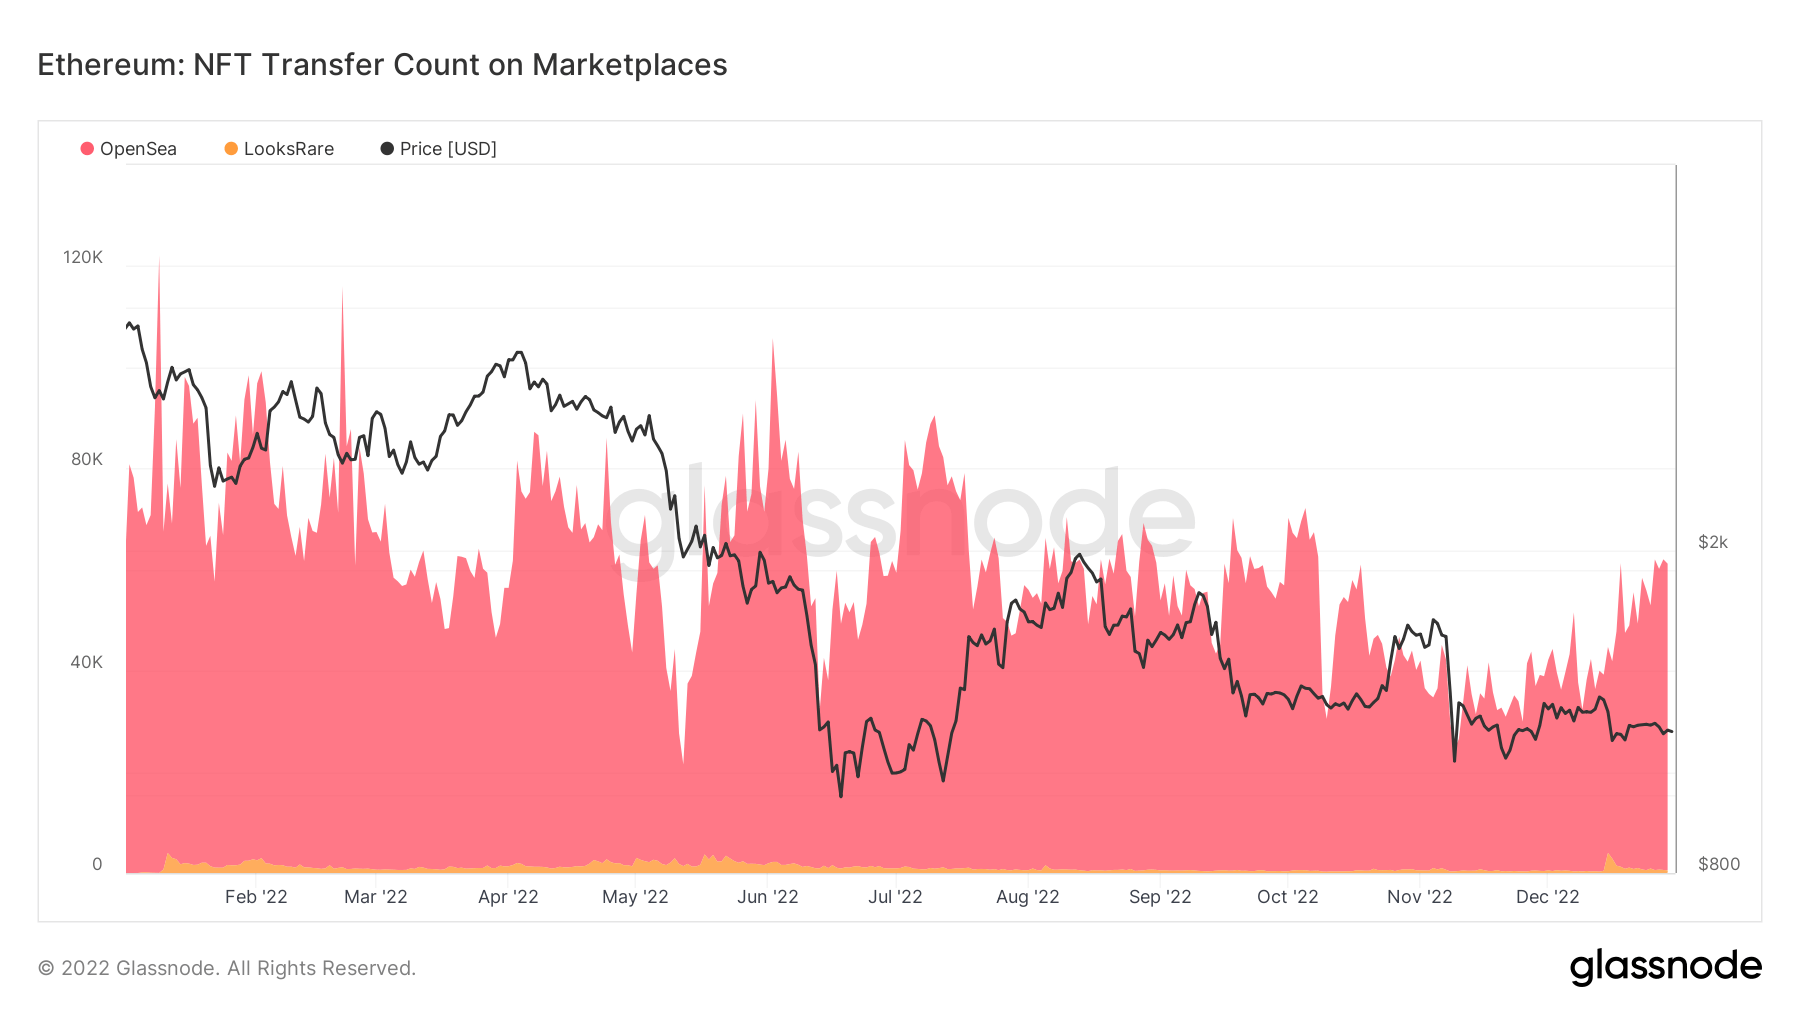
A similar decline in OpenSea's account is also visible in this metric. According to the data, OpenSea started the year with around 80,000 transfers and gradually declined throughout the year. As of Dec. 31, OpenSea facilitates around 60,000 transfers, marking a 25% decrease in volume.
Gas usage by NFTs
The gas usage by NFTs metric calculates a percentage share that represents the relative amount of gas consumed by the Ethereum network due to transactions interacting with NFTs.
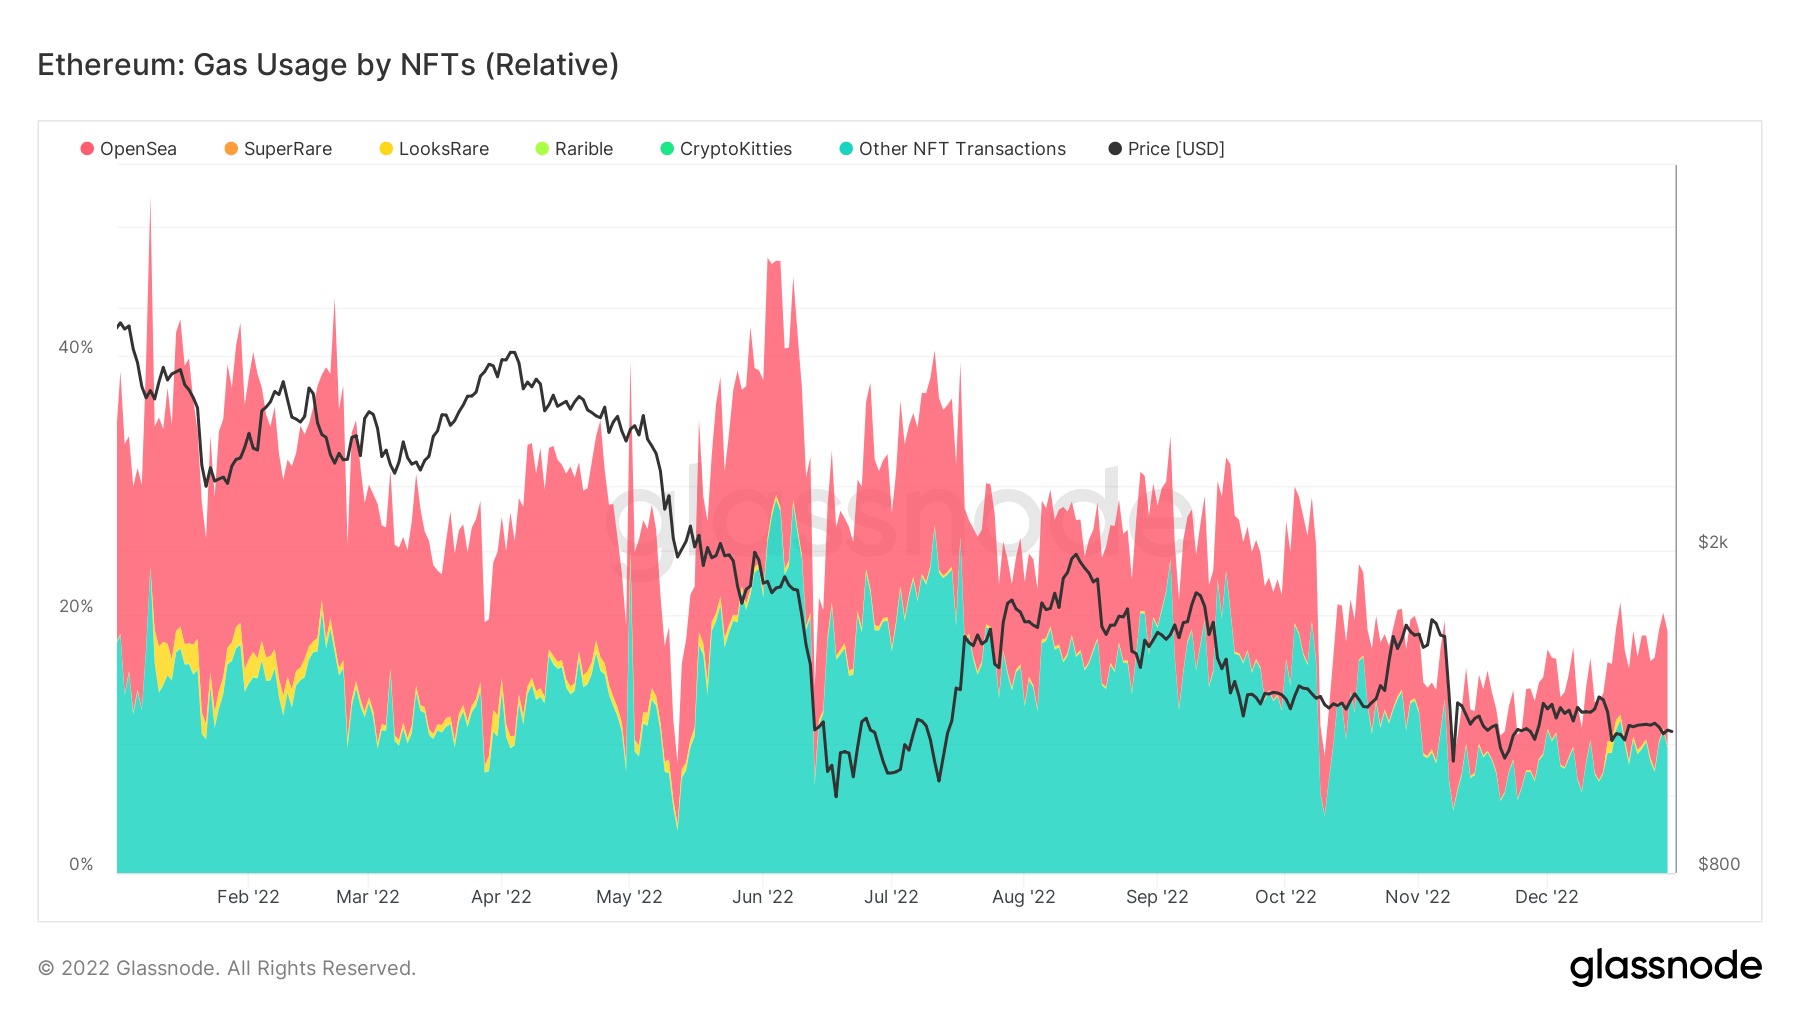
OpenSea's decline can be seen from its gas usage share as well. The marketplace started the year by corresponding to 20% of the whole gas usage and recorded a sharp decline to end it with 9%.