Sat/cent parity possible if we repeat last cycle’s dollar demise
The dollar has fallen 96% against Bitcoin since 2020, repeating this would create sat / cent parity.
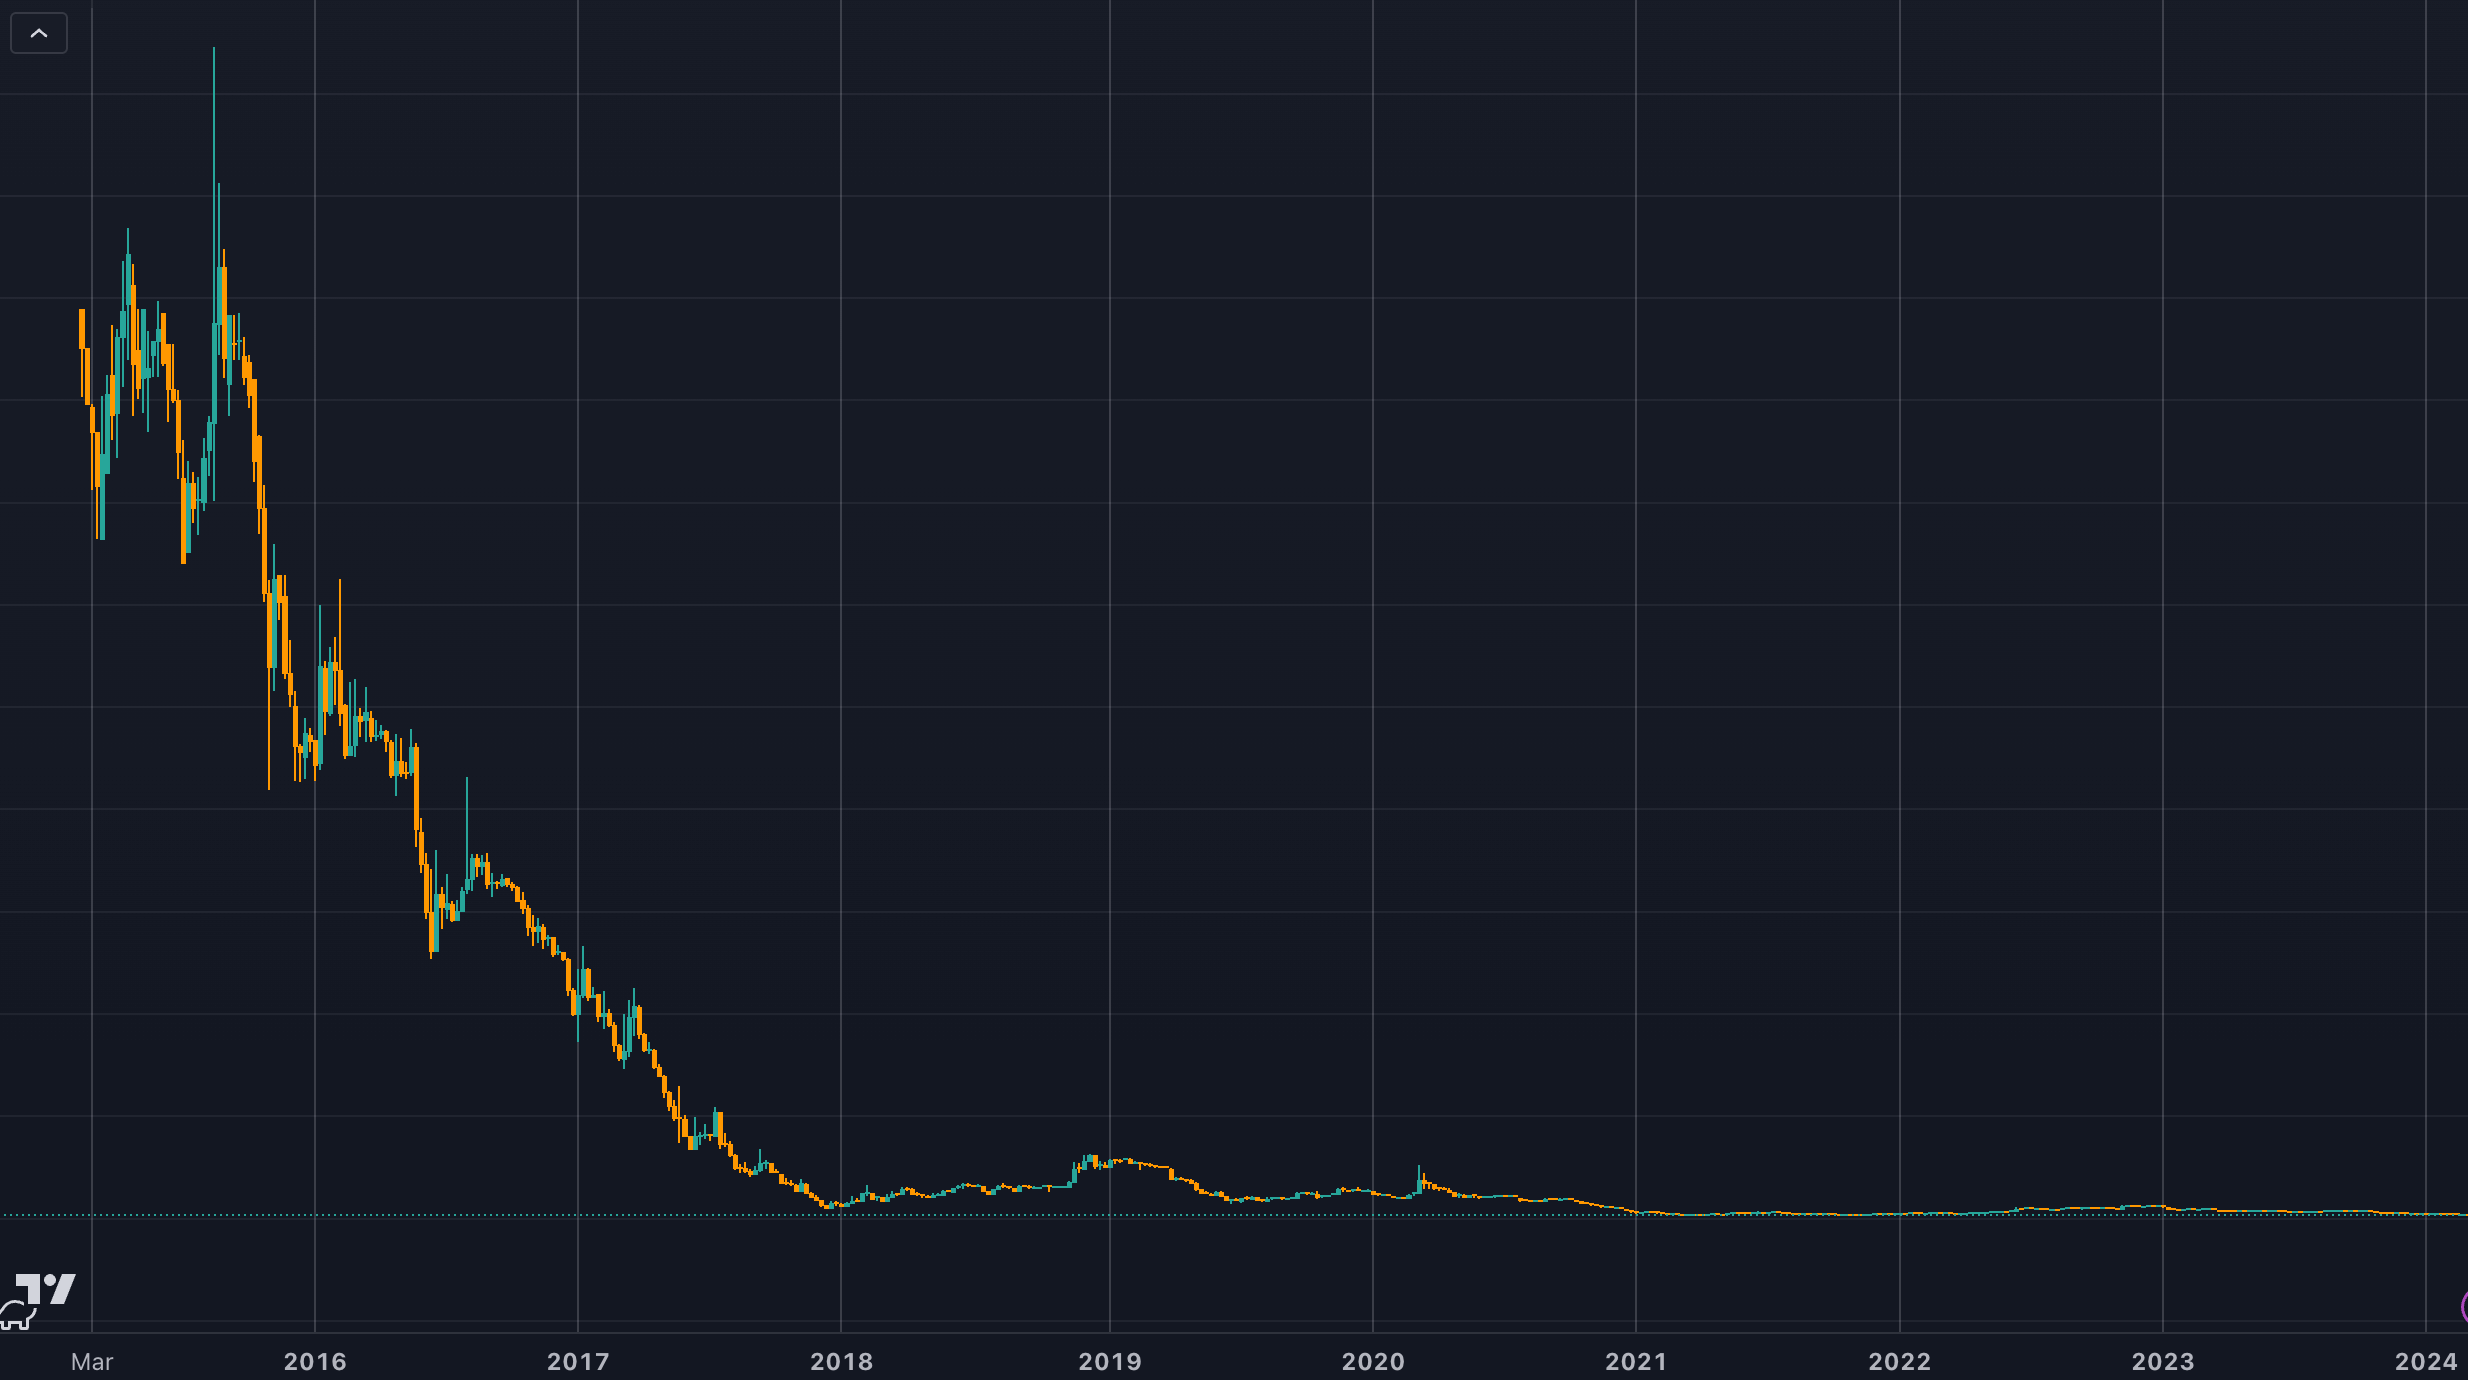
The inverse of the standard BTC/USD chart gives an interesting perspective on the rise in the purchasing power of Bitcoin over time. The USDT/BTC chart below highlights the dollar's decline against Bitcoin since 2015. From its peak, the dollar has fallen 99.7% against Bitcoin.
When viewed in this form, it's hard to be bearish on a 13% dip from a new all-time high.
When we look at the chart over a shorter timeframe in a log format, we can better analyze recent data. Since the COVID-19 crash of May 2020, the dollar has fallen 96% against Bitcoin. Currently, $1 equals around 1,580 satoshis (sats.) A further fall of just 36% would bring us to 1,000 per dollar.
Moreover, for 100 sats to equal $1, the dollar would only need to fall another 93.6%, less than the move last cycle. This would make 1 cent akin to 1 sat, bringing nominal parity between Bitcoin and the dollar in unit terms. The Bitcoin to USD increase would be approximately 1,500% to $1 million.
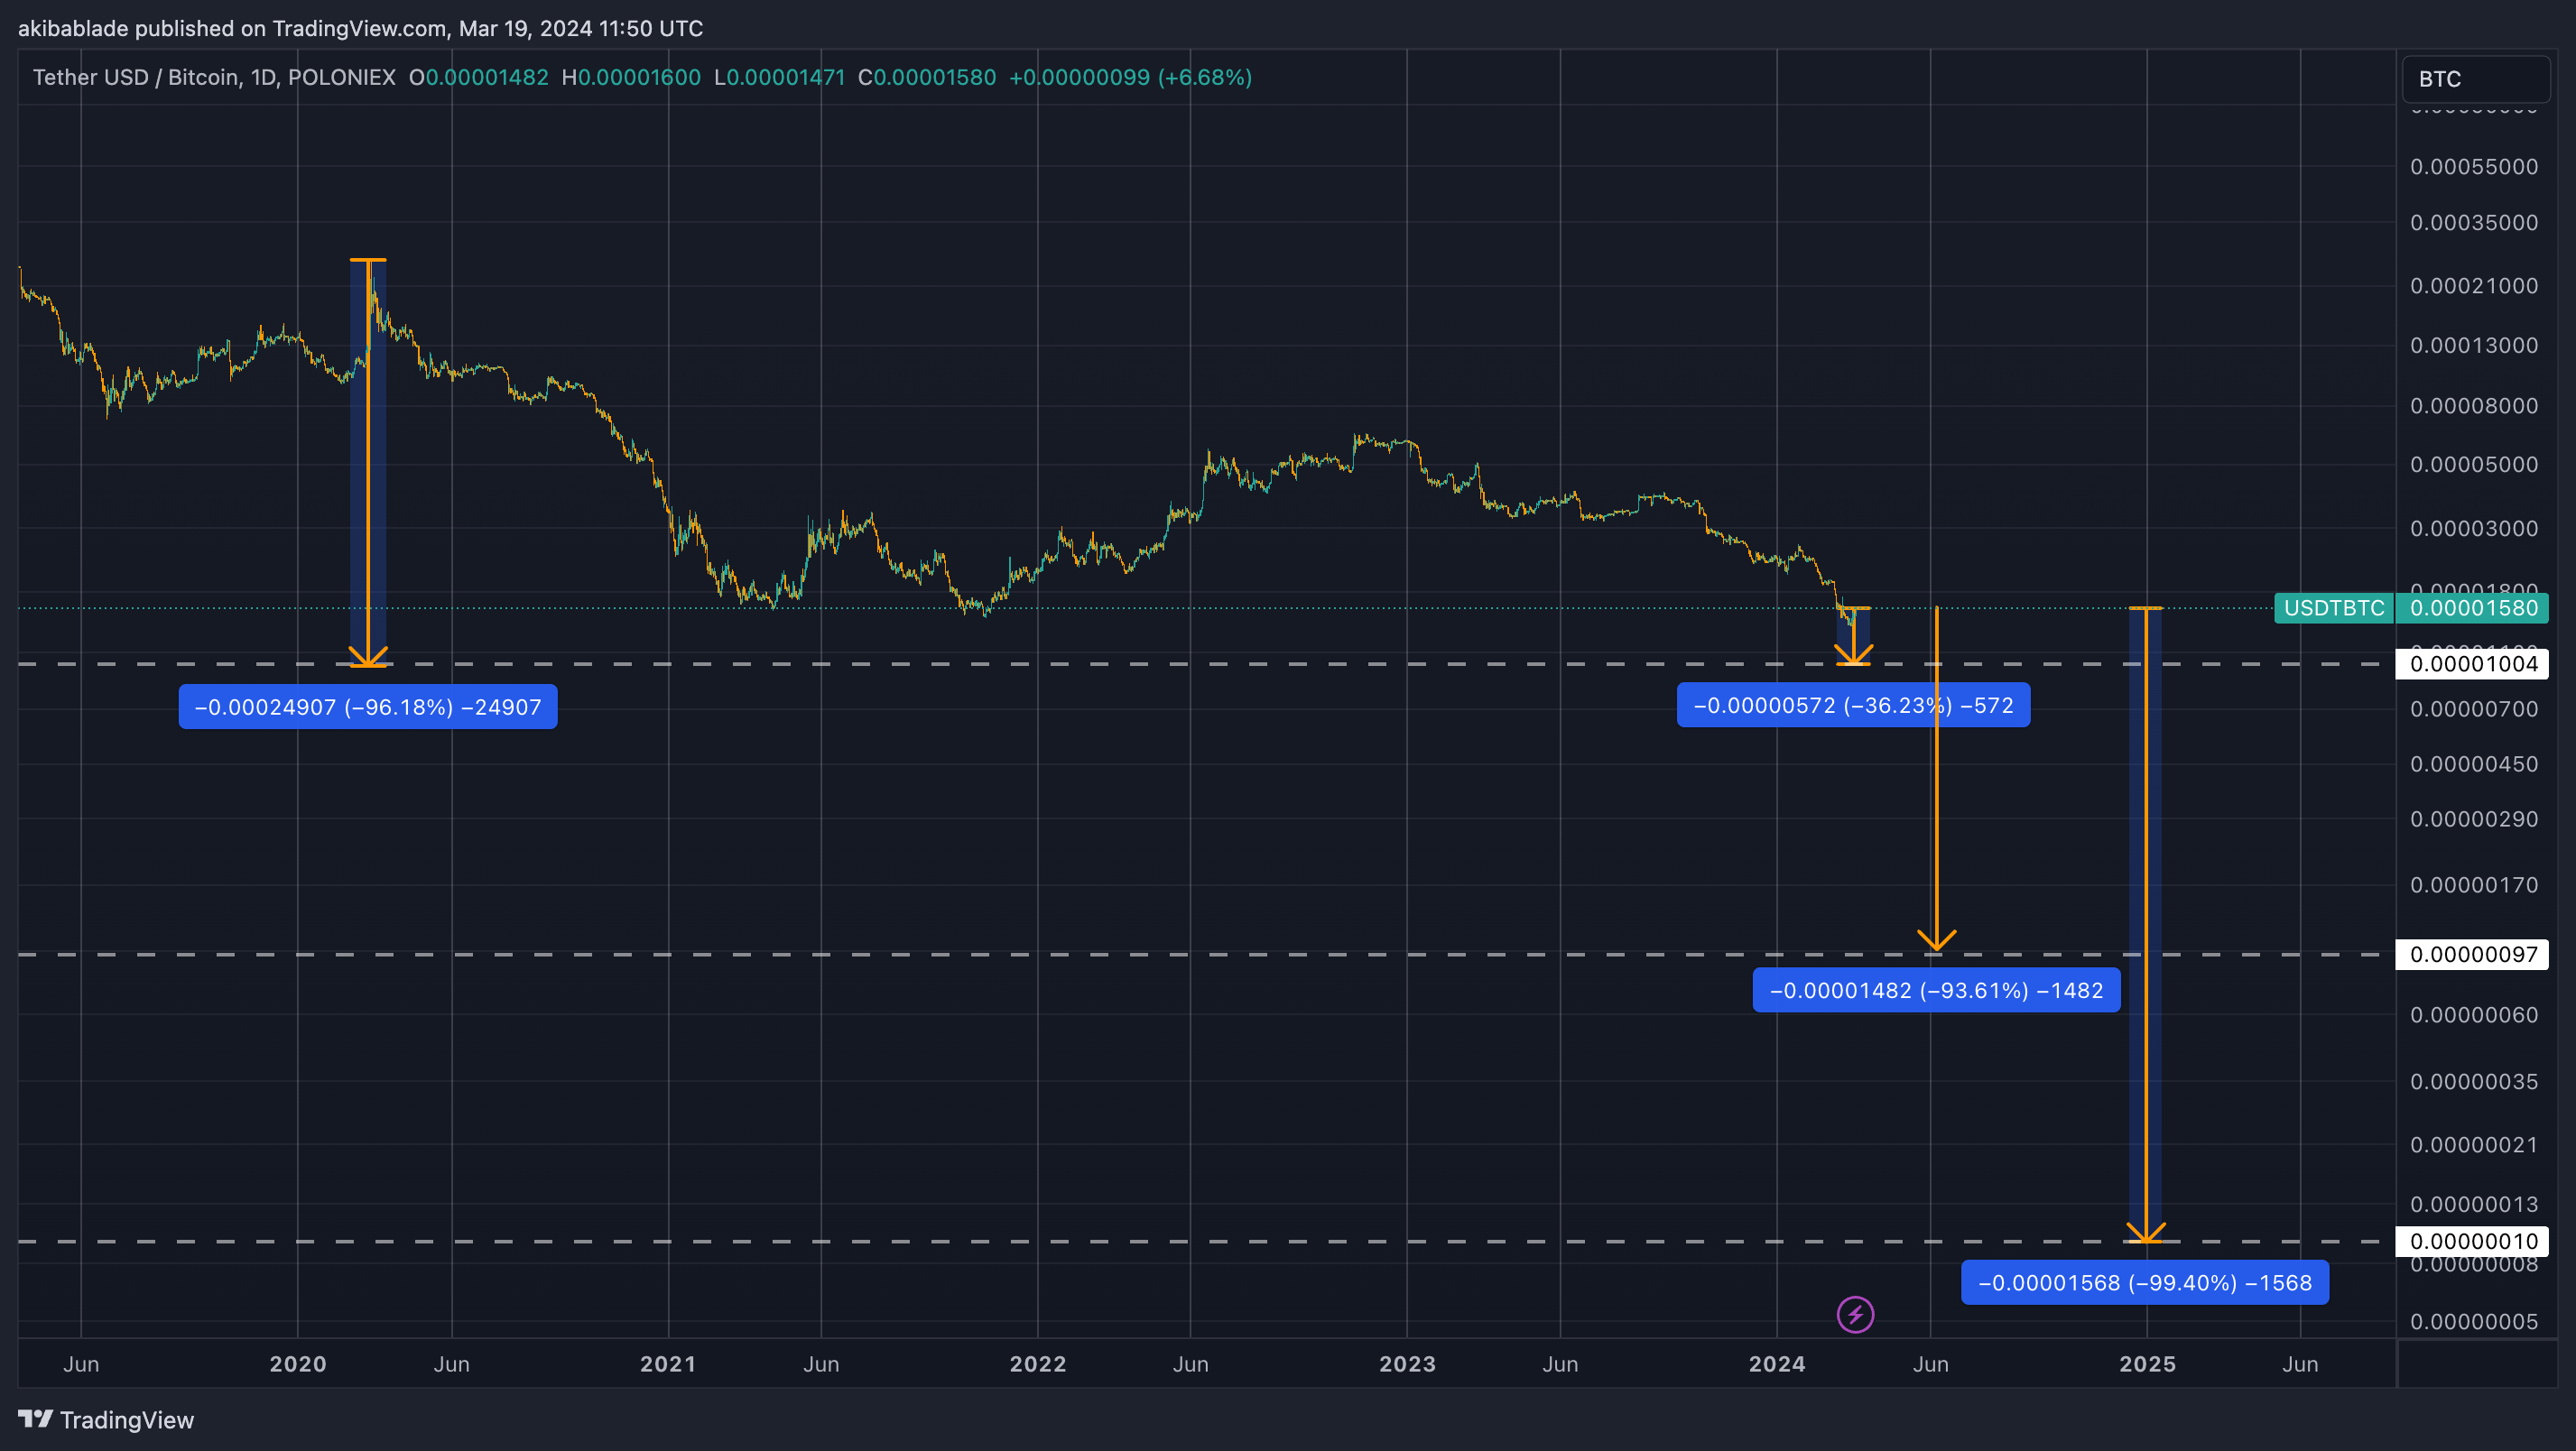
Finally, 10 sats per dollar would require a 99.4% decline, and 1 sat per dollar would total up to 100%. Bitcoin cannot be divided beyond 1 satoshi. Should Bitcoin ever be valued beyond $100 million per coin, we would run out of sufficient notation tools to delineate the exchange rate. However, that would give it a market cap of around $2 quadrillion, over 3 times the value of the world's current wealth.