Overview
Introduction
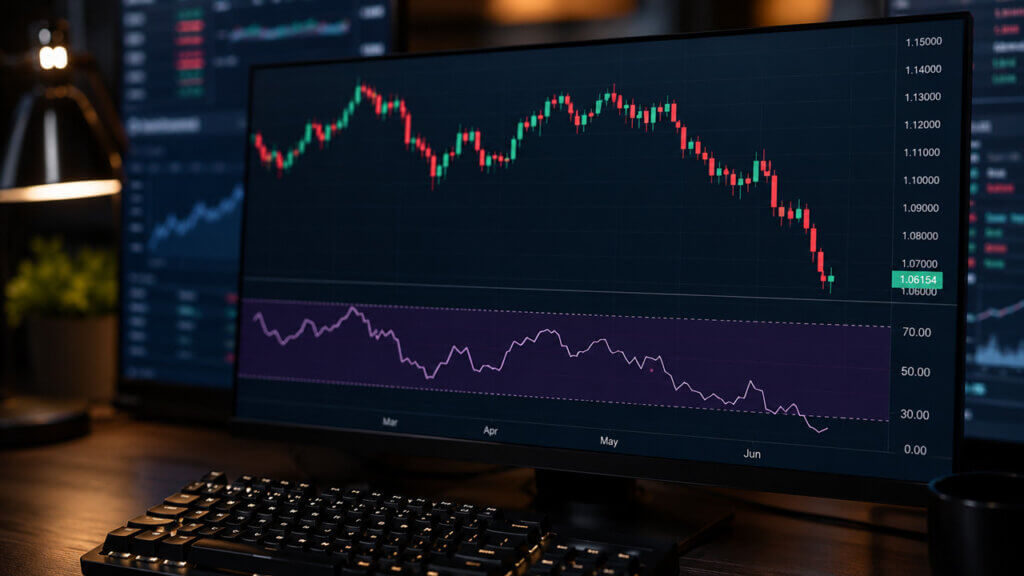
RSI is a momentum indicator that measures how fast and how far price has moved over a set period. It runs between 0 and 100, and traders use it to spot conditions where an asset may be overbought or oversold, or where momentum is starting to shift. On its own, it does not tell you when to buy or sell.
Key Takeaways
- RSI runs between 0 and 100 and measures the speed and size of recent price moves, not price direction alone.
- Readings above 70 are typically labeled overbought and readings below 30 are labeled oversold, but those levels do not guarantee a reversal.
- The default 14-period setting works across most timeframes, but shorter periods create more signals and more noise.
- RSI divergence appears when price and RSI disagree at a swing high or low, warning that momentum may be shifting.
- Fees, slippage, leverage, liquidation risk, and tax obligations can make a clean-looking signal unworkable in practice.
What Is RSI?
RSI stands for Relative Strength Index. J. Welles Wilder Jr. introduced it in his 1978 book New Concepts in Technical Trading Systems, and it remains one of the most widely used technical indicators in both crypto and traditional markets.
The indicator answers a specific question: over the last N candles, how strong have the up moves been compared to the down moves? The result is a single number between 0 and 100. A high reading means recent gains have been larger and more frequent than recent losses. A low reading means the opposite.
RSI does not measure price direction directly. A crypto asset can be in a strong uptrend and still show a low RSI if recent candles have given back gains quickly.
Three things RSI does not do on its own:
- It does not confirm that a trend will reverse.
- It does not account for liquidity, volume, or order-book depth.
- It does not adjust for news, protocol events, or sudden sentiment shifts.
How RSI Is Calculated
RSI (Relative Strength Index) is calculated from the average gain and average loss over a set number of periods, typically 14. The formula uses a smoothed average rather than a simple one, which means early candles have a smaller effect on the current reading than recent ones.
The calculation runs in two steps:
Step 1: Relative Strength (RS)
RS = Average Gain over N periods / Average Loss over N periods
For the first calculation, average gain and average loss are simple averages across N candles. From the second calculation onward, Wilder's smoothing method applies:
- Smoothed average gain = (Previous average gain × (N-1) + Current gain) / N
- Smoothed average loss = (Previous average loss × (N-1) + Current loss) / N
Step 2: RSI
Relative Strength Index = 100 – (100 / (1 + RS))
When average gains are much larger than average losses, RS is high and RSI approaches 100. When average losses dominate, RS approaches zero and RSI approaches 0. A period of equal gains and losses produces an RSI near 50.
Most charting platforms calculate this automatically. Understanding the formula matters because it explains why RSI reacts differently at different period settings, and why changing from 14 to 7 periods does not simply speed up the same signal.
How to Read the RSI Indicator: The 0-100 Scale
Relative Strength Index is easiest to read in three zones: the upper range, the lower range, and the middle.
| RSI Level | Common Label | What It Suggests |
|---|---|---|
| Above 70 | Overbought | Recent gains have been large and fast. A pullback is possible but not guaranteed. |
| 50–70 | Bullish momentum | Gains are outpacing losses. Uptrend conditions are in place. |
| 50 | Midpoint | Average gains and losses are roughly equal. No clear momentum bias. |
| 30–50 | Bearish momentum | Losses are outpacing gains. Downtrend conditions are in place. |
| Below 30 | Oversold | Recent losses have been large and fast. A bounce is possible but not guaranteed. |
The 70 and 30 levels are starting points, not hard rules. In a strong Bitcoin uptrend, RSI can hold above 70 for days or weeks without a meaningful reversal. In a sharp selloff across crypto markets, RSI can stay below 30 far longer than most traders expect.
A more reliable read combines the RSI level with price structure. An oversold reading near a clear support zone carries more weight than the same reading in open air with no nearby level to hold.
The 50 line is underused by beginners. When RSI crosses above 50 and holds, it often confirms that a trend shift is underway rather than just a brief bounce. When it crosses below 50 and fails to recover, it can confirm that selling pressure has taken over.
Best RSI Settings For Crypto Traders
There is no single best RSI setting for every crypto chart. The right setting depends on timeframe, liquidity, and whether the asset is trending or ranging.
| RSI Setting | Best Use |
|---|---|
| 5-7 period RSI | Best for scalping and very short-term crypto charts, but it creates more false signals. |
| 14-period RSI | Best default setting for most traders because it balances signal speed and noise. |
| 21-25 period RSI | Best for swing trading and longer-term trend reads, but signals appear later. |
| 14-period RSI with 80/20 levels | Better for strong trending markets where 70/30 gives too many early warnings. |
| 14-period RSI with 60/40 levels | Better for range-bound markets where traders want earlier momentum shifts near support and resistance. |
For most beginners, the 14-period RSI is still the best starting point. Change the setting only after checking whether it improves the signal on the specific asset and timeframe you trade.
RSI Indicator Settings: Which Period to Use
The default RSI period is 14, based on Wilder's original specification covering two weeks of daily closes. Most charting platforms use 14 as the starting point, and it remains the most widely referenced setting.
Changing the period changes how sensitive RSI is to recent price moves:
| Period Setting | Behavior | Best For |
|---|---|---|
| 7 or lower | Reacts quickly, more signals, more false positives | Scalping, very short timeframes |
| 14 (default) | Balanced sensitivity, widely used as a benchmark | Most timeframes, general analysis |
| 21–25 | Slower reaction, fewer signals, more lag | Swing trading, longer-term trend reads |
For crypto day trading, shorter periods can help catch faster moves, but they also produce more noise on 5-minute and 15-minute charts. For swing setups on Ethereum or other major assets, the default 14-period setting is usually sufficient.
There is no universally best RSI setting. The right choice depends on timeframe, asset volatility, and how many signals the trader can reasonably evaluate. Testing on historical charts before applying any non-default setting to live positions is worth the time.
RSI Overbought and Oversold: What the Levels Actually Mean
Overbought and oversold are the most commonly misread RSI signals. A reading above 70 means recent upward price moves have been stronger and more consistent than usual for that asset over that period. It does not mean a reversal is imminent.
The same logic applies below 30. An oversold reading means selling pressure has been dominant. It is a sign that the move has been fast, not that it is finished.
Two situations where overbought and oversold readings are more reliable:
- When the reading appears near a clear structural level on the price chart, such as a known resistance zone for overbought or a tested support zone for oversold.
- When the reading coincides with a broader trend reversal signal, such as a break of a trendline or a shift in higher-timeframe momentum.
Two situations where they are less reliable:
- During a strong trend. In a sustained crypto bull market, RSI can stay above 70 for extended periods. Selling every overbought reading in a trend is a common way to exit winning positions too early.
- On low-liquidity assets or thin trading pairs, where a single large order can push RSI to an extreme without reflecting genuine market momentum.
Some traders adjust the levels to 80 and 20 for trending markets to reduce false signals. Others use 60 and 40 as the overbought and oversold thresholds for assets in a clear range. Neither adjustment is standard, and both should be tested before use.
RSI Divergence
RSI divergence occurs when price and RSI move in opposite directions at a comparable swing point. It warns that momentum may be weakening even if price has not yet confirmed a change.
This is one of the more advanced RSI applications, and it sits inside a broader set of technical analysis tools rather than working as a standalone signal.
What Is RSI Divergence?
RSI divergence occurs when comparable price highs or lows move differently from the highs or lows on RSI. On crypto charts, that mismatch shows price and momentum are no longer confirming each other.
RSI is a bounded momentum oscillator that tracks the speed and size of recent price moves. Divergence appears when price keeps pushing in one direction while RSI shows that the push is weakening.
These limits keep the warning from becoming a false trade trigger:
- Divergence is a warning, not a buy or sell instruction.
- The swings being compared should be clear and structurally similar.
- Price confirmation matters more than the pattern label.
How RSI Divergence Forms On A Crypto Chart
RSI divergence forms when price and RSI are checked at matching swing points and the two patterns disagree. The comparison only holds when the same type of point is being matched: low to low, high to high, close to close, or wick to wick.
A common mistake is to draw a trendline between two dramatic candles on the price chart, then draw a second line between unrelated RSI points. That approach can make almost any chart appear divergent. A cleaner read starts with obvious structure on price first, then checks RSI to see whether momentum agrees or disagrees.
Before labeling a setup, run through these checks:
- Mark two clear swing lows or two clear swing highs on the price chart.
- Compare the same candle source across both lines, such as closes only or wicks only.
- Confirm that RSI is using the same period and source setting as the comparison.
- Ignore small differences when price is trading sideways with no clear structure.
Bullish RSI Divergence Vs Bearish RSI Divergence
Bullish RSI divergence appears near lows and warns that selling momentum may be weakening. Bearish RSI divergence appears near highs and warns that buying momentum may be fading. The two patterns point to different pressure points in the market.
| Pattern | How To Read It |
|---|---|
| Bullish divergence RSI | Price makes a lower low, but RSI makes a higher low, suggesting downside momentum is losing force. |
| Bearish divergence RSI | Price makes a higher high, but RSI makes a lower high, suggesting upside momentum is losing force. |
A bullish RSI divergence is not a confirmed bottom. A bearish RSI divergence is not a confirmed top. Price can keep falling after a bullish warning when liquidity, funding, or narrative pressure stays strong. Price can keep rising after a bearish warning for the same reasons.
Price confirmation separates a warning from a usable setup. A bullish setup needs price to reclaim a level, break a short-term downtrend, or hold a nearby support zone. A bearish setup needs price to lose a level, reject resistance, or break a rising structure. Without that follow-through from price, the divergence signal remains unfinished.
Regular Vs Hidden RSI Divergence
Regular RSI divergence usually warns about a possible reversal. Hidden RSI divergence usually warns that an existing trend may continue. The difference comes down to whether price is breaking structure or holding it.
Use this RSI divergence cheat sheet as a pattern lookup, not as a trading system:
| Divergence Type | Plain-English Pattern |
|---|---|
| Regular bullish | Price makes a lower low while RSI makes a higher low. Selling pressure may be fading near a low. |
| Regular bearish | Price makes a higher high while RSI makes a lower high. Buying pressure may be fading near a high. |
| Hidden bullish | Price makes a higher low while RSI makes a lower low. An uptrend may be absorbing a pullback. |
| Hidden bearish | Price makes a lower high while RSI makes a higher high. A downtrend may be absorbing a bounce. |
Regular divergence is easier to spot for beginners because it moves against the most recent price direction. If price falls to a new low but RSI refuses to follow, the chart is showing weaker downside momentum.
Hidden divergence is easier to misread. RSI can look weaker even while price structure stays intact. Hidden bullish divergence only makes sense inside an established uptrend with higher lows already in place. Hidden bearish divergence only makes sense inside a downtrend with lower highs already in place. In a choppy sideways range, either pattern is likely noise. Near a clean pullback level inside a clear trend, it can give a more reliable continuation warning.
How To Confirm RSI Divergence Before Acting
RSI divergence should be confirmed by price before it becomes part of any trade plan. The signal says momentum may be shifting, but price is what decides whether the market has accepted that change. Treating the divergence itself as an entry trigger, without waiting for price to move, is the most common way beginner traders lose on an otherwise correct read.
Start with the chart structure closest to the signal. If bullish divergence appears at a swing low, price should stop making lower lows and reclaim a nearby level. If bearish divergence appears at a swing high, price should stop making higher highs and lose a nearby level.
Work through this confirmation checklist before acting on a signal:
- Set the invalidation level first, before the entry, so the maximum loss is known.
- Look for a clear reclaim or loss of a nearby swing level on price.
- Check support and resistance zones around the signal.
- Compare the signal with the trend on a higher timeframe.
- Check volume where reliable data is available.
- Estimate whether the expected move, after fees and spread, still leaves a workable reward-to-risk ratio.
Confirmation reduces the chance of acting on an unfinished pattern, but it does not remove risk. Late confirmation can also weaken the trade: if price has already moved far from the invalidation level, the reward-to-risk ratio shrinks even on a correct call.
Where RSI Fails In Crypto
RSI fails most often when the market is trending hard, ranging without clear structure, or moving through low-liquidity conditions. In those settings, RSI can flash a warning while price keeps extending in the original direction, sometimes for multiple candles or even days.
Leverage makes that gap dangerous. On crypto futures exchanges, a position can be liquidated before a longer-timeframe RSI signal has time to resolve. A signal can be directionally correct and still be unusable if position size, leverage, or entry price is wrong.
Thin markets create a separate failure mode. When a trade routes through a decentralized exchange, pool depth, routing, and slippage can move the real entry far from where the chart showed it.
Watch for these crypto-specific failure conditions:
- Lower-timeframe noise on 5-minute and 15-minute charts produces frequent signals with low follow-through.
- Large single-candle moves driven by whale orders can distort RSI swings and create false-looking divergence.
- Sudden news or protocol events can break technical structure before a setup resolves.
- Wide spreads on small-cap pairs can eliminate the expected reward before the trade is even placed.
- DEX slippage can shift the real entry significantly from the chart price.
- Perpetual funding costs add continuous drag on positions held open while waiting for a setup to resolve.
RSI says momentum is worth investigating. It does not say liquidity is adequate, the exchange will stay online, or the next candle will reverse.
RSI Indicators, Alerts, And Settings
An RSI indicator can find possible signals faster than manual scanning, but it can also mark weak conditions that an experienced trader would ignore. Automatic tools are useful for building a watchlist, not for replacing judgment.
The standard starting point is a 14-period RSI. Shorter periods react faster and create more false positives. Longer periods react later and can miss the quick moves common in volatile crypto markets.
Before using any RSI indicator or alert live, check these settings:
- Confirm that the period and source (close, open, wick) match what was used during analysis.
- Check whether divergence detection, if enabled, waits for pivot confirmation before marking a signal.
- Test the alert on several historical charts before using it on live positions.
- Review whether overbought and oversold thresholds have been adjusted from the defaults, and whether that change is intentional.
RSI vs MACD And StochRSI
RSI, MACD, and StochRSI all measure momentum, but they use different inputs and react at different speeds. Choosing between them depends on whether the goal is cleaner swing comparison, trend acceleration context, or faster sensitivity to short-term extremes.
Each indicator has a primary job:
| Indicator | Best Use |
|---|---|
| RSI | Cleaner swing-high and swing-low comparisons on price momentum. Overbought and oversold reads. |
| MACD | Trend acceleration, crossover context, and momentum shifts around moving averages. |
| StochRSI | Faster momentum extremes, with more noise and more frequent false signals. |
RSI is generally simpler for beginners because it stays between 0 and 100, making levels straightforward to read. MACD can add useful trend context but tends to lag because it depends on moving averages. StochRSI can help when more sensitivity is needed, but that sensitivity also generates extra noise in choppy markets.
Agreement between indicators carries more weight than stacking them for confirmation. If RSI shows an oversold reading near a clear support level and MACD also shows fading downside momentum, that warning has more structural backing than a single-indicator read. Using RSI and StochRSI together produces far less useful confirmation because they share underlying inputs and are not independent reads of the market.
A Practical RSI Example
A practical example is clearer when it uses a generic chart sequence rather than a live market call. The goal is to understand how RSI behaves during a real price move, not to suggest that any specific asset is set up right now.
Liquid markets make better teaching examples because a single small trade is unlikely to distort the chart. Bitcoin is often the clearest reference for swing structure, while Ethereum provides a second major-market example without relying on thin-token behavior.
Overbought example: Price rallies sharply over several candles. RSI climbs above 70 and reaches 78. The reading warns that recent gains have been unusually strong relative to losses. Price then stalls at a resistance zone and begins to pull back. The RSI reading did not cause the reversal, but it flagged that momentum was stretched before the stall.
Oversold example: Price sells off over several candles and RSI drops below 30 to 24. The reading warns that recent losses have been unusually large. Price finds a support level and bounces. Again, the RSI reading flagged the stretch before price confirmed the low.
Divergence example: Price makes a lower low after a selloff, but RSI makes a higher low. That warns that sellers may be losing pressure. The setup remains unfinished until price closes back above a nearby level.
Walk through any RSI setup in this order:
- Check the RSI level and note whether it is in overbought, oversold, or mid-range territory.
- Look at price structure to see whether a clear swing high or low is forming.
- Check whether RSI is confirming or disagreeing with that price move.
- Wait for price to reclaim or lose a nearby level before considering an entry.
- Measure the distance to invalidation and check fees, spread, and slippage before sizing.
The invalidation level is what makes any example usable. If a trader cannot say where the setup is wrong, the RSI reading alone is not enough.
FAQs
What does RSI in trading stand for?
RSI stands for Relative Strength Index. It was developed by J. Welles Wilder Jr. and published in 1978.
What is a good RSI level to buy?
There is no universally good RSI level to buy. Readings below 30 are labeled oversold and can precede a bounce, but price can stay below 30 for an extended period during a strong downtrend. A low RSI reading is more useful when it appears near a clear support level and price confirms a reversal.
What does RSI above 70 mean?
An RSI above 70 means recent gains have been larger and more consistent than recent losses over the measurement period. It is labeled overbought, which warns that the move may be stretched. It does not confirm that a reversal is coming.
What is the best RSI setting?
The standard starting point is 14 periods, based on Wilder’s original specification. Shorter periods (7 or below) react faster but generate more noise. Longer periods (21 or above) react more slowly and suit swing trading. There is no single best setting that works across all assets and timeframes.
What is the difference between RSI and MACD?
RSI measures the speed and size of recent price moves on a 0-100 scale. MACD measures the difference between two moving averages and shows trend acceleration and crossover points. RSI is generally easier for beginners to read at a glance. MACD adds context about trend direction and momentum shifts that RSI alone does not provide.
What is RSI divergence?
RSI divergence appears when price makes a new high or low but RSI moves in the opposite direction at the same swing point. It warns that momentum may be weakening, but it requires price confirmation before it becomes part of a trade plan.
Is RSI divergence enough to buy or sell crypto?
No. RSI divergence alone is not enough to buy or sell. It should be confirmed by price structure, higher-timeframe trend direction, liquidity, fees, and a clear invalidation level before it becomes part of a trade plan.
What is the difference between regular and hidden RSI divergence?
Regular divergence usually warns about a possible reversal because price makes a new extreme while RSI fails to confirm it. Hidden divergence usually warns about trend continuation because price structure holds while RSI pulls back further.