


Overview
Introduction
Bitcoin (BTC) hashrate is the estimated computing power miners use to secure Bitcoin by trying trillions of SHA-256 hashes each second. The number is useful only when a chart separates network power from a single miner's machine output, states its time window, and shows how difficulty turns raw computing power into security and revenue pressure.
Key Takeaways
- Bitcoin hashrate estimates how many mining hash attempts secure the network each second.
- Higher network power makes attacks more expensive and changes how miners compete for block rewards.
- Network hashrate is different from a single miner's advertised machine output.
- The estimate comes from blocks and difficulty, so short-term chart moves can mislead.
What Is Bitcoin Hashrate?
Bitcoin hashrate is the total estimated speed at which miners are trying valid block hashes across the entire Bitcoin network. The core meaning is simple: more hashes per second means miners are spending more repeated guesses on Bitcoin's proof-of-work puzzle, and that puzzle is what keeps the network secure.
Where beginners get tripped up is confusing network-level hash power with device output. A single ASIC miner reports its performance in TH/s, terahashes per second, while the full Bitcoin network is measured in EH/s, exahashes per second, because it combines the output of thousands of miners and pools worldwide. Those units sit on completely different scales.
The table below separates the four terms you will see in mining news and on hashrate dashboards:
| Term | Plain-English Meaning |
|---|---|
| Miner hashrate | The output of one machine, mining farm, or account. |
| Pool hashrate | The combined output miners point at one pool for steadier payouts. |
| Bitcoin network hashrate | The estimated total work securing Bitcoin across all miners. |
| Effective hashrate | A miner's observed contribution after downtime, pool variance, and rejected shares. |
A high network figure does not mean any one miner is earning more. It means miners collectively are performing more work, and each miner's share of the reward depends on how much of that total they contribute.
How the Bitcoin Mining Hashrate Loop Works
In crypto mining, miners do not solve a mathematical riddle by reasoning through it. They run a brute-force speed contest, hashing candidate block headers over and over until one hash falls below Bitcoin's current target. That target is the proof-of-work threshold that makes finding a valid block expensive while keeping verification cheap. This is what proof-of-work means in practice.
The loop breaks into five steps:
- A miner builds a candidate block from valid transactions and block data.
- Mining hardware hashes the block header while changing the nonce and other adjustable fields.
- Most hashes fail because they sit above the current target.
- A successful hash below the target proves enough work was done.
- The miner broadcasts the block, and nodes verify the proof and the block rules.
In the Bitcoin mining workflow, mining software sends the 80-byte block header and target threshold to ASIC hardware, then receives a successful header when the hash falls below the target.
The SHA-256 Guessing Loop
The SHA-256 loop is a speed contest. A miner changes the nonce or other data in the candidate block header, hashes it, checks the result against the target, and repeats that cycle as fast as the hardware allows.
A nonce is only one adjustable field. When miners exhaust one nonce range, they can change other block data, such as coinbase extra nonce data or transaction ordering, to create fresh headers to hash. That flexibility is what keeps the loop running continuously at scale.
This loop is also why network hashrate is an estimate rather than a live reading from a global mining meter. Blocks and difficulty reveal the work after the fact. Individual ASICs do not report a single live total to Bitcoin, so every hashrate chart you see is inferred, not measured directly.
Why Blocks Still Average Around 10 Minutes
Blocks still average around 10 minutes because Bitcoin adjusts difficulty every 2,016 blocks. If blocks arrived too quickly during the previous adjustment window, the next target becomes harder. If blocks arrived too slowly, the target becomes easier.
That mechanism is why more network hash power does not make blocks permanently faster. More machines can find blocks faster for a short period, but the next difficulty adjustment pushes the average back toward the protocol target. Every valid block still needs a hash below the target threshold, so the system self-corrects. This is also why you cannot use hashrate alone to predict block times.
How to Read Hashrate Units and Charts
A Bitcoin hashrate chart shows estimated network work over a time window, usually labeled in units like TH/s or EH/s. The scale can look intimidating because Bitcoin's network operates far beyond what any consumer hardware can produce.
These are the full unit conversions from smallest to largest:
| Unit | What It Means |
|---|---|
| H/s | One hash attempt per second. |
| TH/s | One trillion hashes per second. Common for individual ASIC machines. |
| PH/s | One thousand TH/s. Useful for larger operations. |
| EH/s | One million TH/s. Common for Bitcoin network-level discussion. |
| ZH/s | One thousand EH/s. Useful when the network approaches zettahash scale. |
Converting the unit is the first step, but it does not explain what the chart is actually showing. You also need to check the averaging window. Bitcoin's blockchain produces blocks probabilistically, not on a perfect schedule, so a one-day estimate can swing hard based on nothing more than random timing. A 7-day average is more reliable for spotting real trends. The Bitcoin total hash rate chart uses 7-day averaging and labels the Y-axis in TH/s, which is worth bookmarking as a reference point.
Before drawing any conclusion from a hashrate chart, check four things: the source, the time window, the unit, and the timestamp. Two dashboards can show different numbers for the same day without either being wrong, because both are inferring from block timing rather than reading from a live counter.
Network Hashrate and Bitcoin Security
A higher Bitcoin network hashrate makes the network more expensive to attack. An attacker trying to rewrite recent history or censor transactions would need to control or rent enough proof-of-work capacity to overpower honest miners for a sustained period. The larger the hashrate, the more hardware and energy that requires.
A higher hashrate improves security in four concrete ways:
- It raises the work required to compete with honest miners.
- It makes large chain reorganizations harder to sustain.
- It increases the hardware and energy coordination an attacker needs.
- It can reflect deeper miner investment in Bitcoin infrastructure.
That said, hashrate alone does not prove decentralization. Mining pools can coordinate large portions of hash output. Public miners can face identical energy and capital pressures at the same time. Geographic concentration can still create policy or grid risks. One jurisdiction losing power access can move the global hashrate chart in a matter of days.
Hashrate works best as a cost-of-attack signal. Read it alongside pool distribution, node diversity, fee markets, and miner economics for a fuller picture of Bitcoin network health.
Why Network Hashrate Goes Up or Down
Bitcoin's network hashrate rises or falls when mining economics, hardware deployment, energy availability, and short-term operating conditions change. Hashrate headlines tend to focus on a single chart move, but the cause is usually a combination of incentives and logistics playing out across thousands of independent operations simultaneously.
Mining is a margin business. Miners add machines when expected revenue justifies power, hardware, cooling, maintenance, and financing costs. They shut down, curtail, or delay machines when those inputs stop working. The main drivers break down as follows:
| Driver | What It Changes |
|---|---|
| BTC price | Higher prices can support more mining capacity, often with a lag. |
| Block subsidy and fees | Miner revenue changes when rewards or transaction fees rise or fall. |
| ASIC efficiency | Newer machines can produce more hashes per unit of electricity. |
| Electricity prices | Higher power costs can push older machines offline. |
| Weather and grid stress | Heat, storms, or curtailment can reduce short-term output. |
| Regulation and permits | Policy changes can slow expansion or shift mining locations. |
| Hardware delivery | New capacity often arrives months after miners order machines. |
Subsidy cuts, which happen every four years through the Bitcoin halving, increase pressure on miners running older machines or paying above-average power costs. A fee spike can offset some pressure for a time, but fees are variable and cannot be plugged into a static profitability model as a constant. Daily estimates can fall because of weather, power curtailment, pool luck, or delayed reporting without implying anything has broken.
Hashrate, Mining Difficulty, and Miner Profitability
Hashrate, mining difficulty, and miner profitability are connected but are not measuring the same thing. Hashrate estimates work being performed, difficulty sets how hard it is to find a valid block, and profitability measures whether a miner's share of rewards covers all costs.
Hashrate vs. Difficulty
Hashrate and difficulty move through a feedback loop. When more hash power joins Bitcoin, blocks can arrive faster until the next retarget. Difficulty then rises, which means each unit of hashrate earns a smaller expected share unless fees, BTC price, or efficiency improve enough to compensate.
Two operating layers sit on top of that feedback loop:
- Mining pool companies coordinate payout shares for miners who want steadier, more predictable rewards.
- Bitcoin mining companies compete on power contracts, ASIC fleets, uptime, financing, heat management, and operational discipline.
A higher network hashrate can simultaneously make Bitcoin harder to attack and make weaker miners less profitable. Those two outcomes are not in conflict.
What a Hashrate Calculator Can and Cannot Tell You
A hashrate calculator estimates mining revenue from machine speed, power use, electricity cost, pool fees, and current difficulty. It cannot guarantee ROI because every major input in that calculation changes over time, sometimes within days.
Before relying on any bitcoin hashrate calculator output, check the assumptions behind the number:
- Machine hashrate and power draw
- Electricity rate and demand charges
- Pool fee and payout method
- Current difficulty and expected retarget
- BTC price and transaction-fee assumptions
- Uptime, heat, noise, repair, and hosting costs
- Hardware resale value and delivery timing
The common mistake is treating one calculator result as a business plan. A profitable-looking ASIC can turn unprofitable after a difficulty jump, a power price increase, a hardware delay, or a BTC price drawdown. All four can happen in the same quarter.
What Is Hashprice and Why Does It Matter?
Hashprice is the daily revenue a miner earns per terahash of output, usually expressed in USD/TH/day or sats/TH/day. It is a more useful profitability signal than raw hashrate alone because it combines BTC price, block subsidy, transaction fees, and difficulty into a single number.
When hashprice falls, miners with high power costs or older hardware are the first to shut off machines. That is often what causes short-term hashrate drops on the chart. When hashprice rises, it typically accelerates new machine deployments. Watching hashprice alongside the hashrate chart helps explain why the network is moving, rather than just showing that it moved.
Are Network Hashrate And Coin Price Connected?
Network hashrate can reflect miner commitment and signal security pressure, but it does not forecast Bitcoin's price. Price, fees, capital markets, hardware cycles, and difficulty all interact with the metric in both directions, and those interactions do not follow a fixed sequence.
Useful signals from hashrate data include:
- Sustained hash growth can imply miners are deploying capital and expect continued revenue.
- Rising difficulty reveals tougher competition for block rewards.
- Falling hashprice can pressure less efficient miners toward shutdown.
Inferences that the data does not support:
- Higher hashrate does not guarantee BTC price will rise.
- A lower daily estimate does not prove the network is failing.
- Mining growth does not mean every miner running machines is profitable.
In most cycles, price moves first and miners respond later by ordering, deploying, or shutting off machines. That lag means a rising hashrate often describes past investment decisions rather than current confidence.
Current Bitcoin Network Hashrate: How to Check It Safely
The current Bitcoin network hashrate belongs in a live dashboard, not a fixed evergreen sentence, because the estimate changes continuously and any number printed in an article goes stale within hours.
Use a live source such as the Mempool.space mining dashboard or Blockchain.com's hash-rate chart. When you pull the number, capture the unit and time window alongside it. One dashboard may display the figure in EH/s while another shows TH/s for the same moment. Both can be correct.
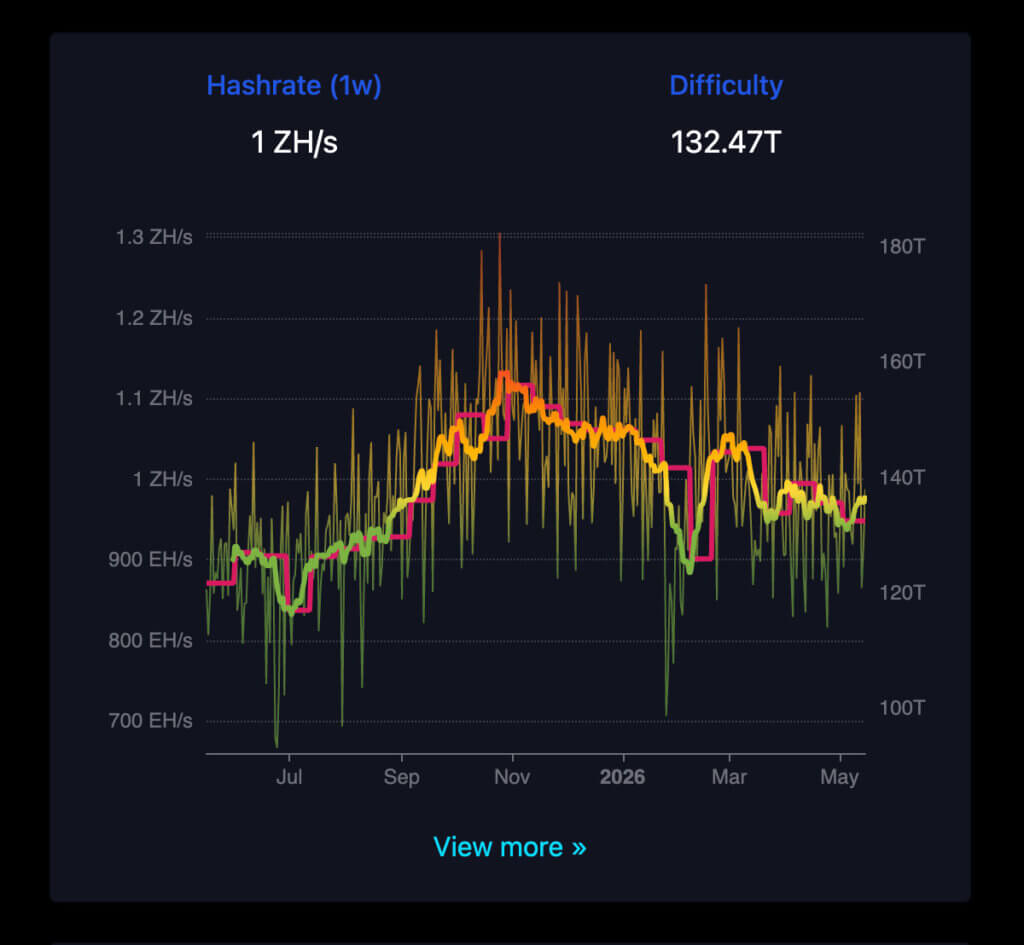
Before quoting any current hashrate figure, check these five things:
- Source: which dashboard produced the estimate?
- Window: is it daily, 3-day, 7-day, or longer?
- Unit: is the number in TH/s, EH/s, or ZH/s?
- Timestamp: when was the value captured?
- Method: is it inferred from blocks and difficulty?
If a chart displays the current network estimate in TH/s and you want EH/s, divide by one million. For trend context, prefer a 7-day average over a daily figure, since short samples can overstate or understate the real trend based on random block timing alone.
FAQs
What is bitcoin hashrate in simple terms?
It is the estimated number of hash attempts miners make each second while competing to add the next valid Bitcoin block.
What is the current Bitcoin network hashrate?
The current Bitcoin network hashrate changes constantly. Check a live dashboard such as Mempool.space or Blockchain.com and note the unit, timestamp, and averaging window alongside the figure.
Does a higher hashrate make Bitcoin more secure?
A higher hashrate generally makes attacks more expensive because an attacker needs more competing mining power, but it does not prove decentralization or eliminate mining-pool concentration risks.
Does Bitcoin hashrate affect the price?
The metric can reflect miner investment and network security, but it does not reliably predict price. BTC price, fees, difficulty, and mining costs all interact with each other independently.
How is Bitcoin hashrate calculated?
Network hashrate is inferred from blocks found and current difficulty, not collected directly from every mining machine connected to the network.
Can Bitcoin hashrate go down?
Yes. It can fall when miners shut off machines because of power costs, weather, regulation, lower revenue, hardware delays, or short-term operating disruptions.
What is a good Bitcoin hashrate for a mining machine?
This depends on the era. Today’s competitive ASICs typically run between 100 TH/s and 300 TH/s. A machine below 50 TH/s is likely running at a loss at current difficulty unless power costs are exceptionally low. Always compare against current difficulty, not just advertised TH/s specs.
What happens to hashrate after a Bitcoin halving?
After each bitcoin halving, block rewards drop by 50%, which reduces miner revenue per block at any given BTC price. Miners with higher costs or older hardware typically shut off machines first, causing a short-term hashrate drop. Difficulty then adjusts downward at the next 2,016-block retarget, partly offsetting the revenue pressure. The 2024 halving followed this pattern.