Bitcoin, Ethereum, and XRP may be preparing for a breakout

Cover art/illustration via CryptoSlate. Image includes combined content which may include the use of AI tools.
Thus far, 2020 seems to have brought back volatility into the cryptocurrency market. On Jan. 2, the entire market capitalization dropped nearly 4 percent, but the next day $14 billion were injected into the market. Now, it seems like Bitcoin, Ethereum, and XRP could be preparing for a significant price move.
Bitcoin (BTC)
On Jan. 3, Bitcoin went from trading at a low of $6,900 to a high of $7,440. The sudden 7.75 percent price jump created a bullish engulfing candlestick on BTC’s 1-day chart. This technical pattern is considered a bullish formation that is likely to reverse the bearish trend seen over the last few months.
It is worth noting that the fact that this bullish engulfing candlestick is overlapping the preceding four candlesticks makes it more effective. But, the bullish outlook will be confirmed once the succeeding candlestick closes above the engulfing one.
The TD sequential indicator seems to have predicted the unexpected upswing that took Bitcoin to $7,440. On Jan. 2, as Bitcoin plunged to $6,960, this technical index presented a buy signal in the form of a sequential 13. Like the bullish engulfing candle, this bullish signal will be validated the moment the current green two candlestick starts trading above the preceding green one.

Despite the bullish perspective, Bitcoin remains contained within the Bollinger bands, which have been squeezing since Dec. 10. Squeezes are typically followed by periods of high volatility. The longer the squeeze, the higher the probability of a strong breakout.
Thus far, BTC is trading within the lower and upper Bollinger band for the past 25 days. This trading range is a reasonable no-trade zone due to the high risk that it poses to trade within it. The area sits between $6,850 and $7,580.
A break below the $6,850 support level could send BTC down for a deeper correction. Based on the Fibonacci retracement indicator, such a bearish impulse could take the flagship cryptocurrency to the next level of support around the 78.6 percent Fibonacci retracement level, at $5,470.
Nevertheless, a spike in the buying pressure behind Bitcoin that allows it to close above the $7,580 resistance level could trigger an increase in demand. If this happens, Bitcoin will likely surge to test the next levels of resistance given by the 50 and 38.2 percent Fibonacci retracement levels, which are sitting at $8,500 and $9,700, respectively.
Ethereum (ETH)
Ethereum seems to be forming an ascending triangle on its 1-day chart. This technical pattern is developing since mid-December as a direct result of ETH’s price action. A horizontal line is forming along with the swing highs and a rising trendline along with the swing lows.
By measuring the height of the triangle, at its thickest point, this pattern presents a 9.12 percent target to the upside. A close above the overhead resistance at $135 can validate this pattern, and Ethereum would likely surge to $147.70.
However, an increase in selling pressure that takes ETH to break below the hypotenuse could push the price of this cryptocurrency down. At the moment, it seems like if Ethereum closes below $127.50, it will try to reach a lower low.

The moving averages give a similar perspective. On the upside, if Ethereum can close above the 30-day moving average, it could try to test the next level of resistance around the 50-day moving average at $144. Conversely, a close below the 7-day moving average could trigger a spike in sell orders pushing this cryptocurrency down.
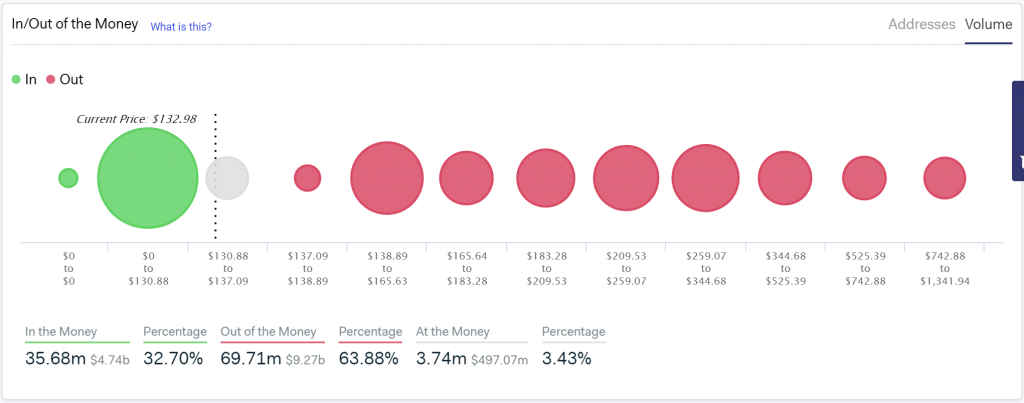
The “In/Out Money” model from IntoTheBlock considers the distribution of Ethereum throughout individual wallets based on the current price. Based on this metric, if ETH is indeed bound for an upswing, it will find strong resistance between $139 and $166. In this area, 3.03 million addresses are holding 15.32 million ETH.
On the downside, this model also stipulates that there could be significant support around $100. Around this price level, 3.58 million addresses are containing over 34.72 million ETH.
XRP
From a long term perspective, the TD sequential indicator could soon present a buy signal in the form of a red nine on XRP’s 1-week chart. If this happens, this cryptocurrency could be preparing for an upswing that allows it to reach higher highs. It will all depend on whether the setup trendline continues to serve as a significant support point as it has done it for the last three weeks.
Based on its 1-day chart, XRP is trading within a no-trade zone since mid-December. This area sits between the $0.184 support level and the $0.197 resistance level. Closing below or above this area will determine where XRP is heading next.
A bullish impulse that takes XRP to close above $0.197 could take it to the next level of resistance at $0.215 or $0.233. On the other hand, breaking below $0.184 could push this cryptocurrency down to $0.166 or $0.148.
Overall sentiment
Based on the previous technical analysis, it seems like the top three cryptocurrencies by market cap are sitting at a make-or-break point. An inflow of capital into the market would likely trigger a price increase. Such a bullish impulse will take these cryptos into higher highs. But, breaking below their respective support levels could push the market into lower lows. It would be worth paying close attention to the support and resistance levels mentioned above to benefit from the next major price move.