


 Analysis of Bitcoin addresses shows that BTC is about to tap a massive resistance region
 🚨 This article is 4 years old...
Analysis of Bitcoin addresses shows that BTC is about to tap a massive resistance region
2 min read
Updated: May. 8, 2020 at 12:11 pm UTC
Photo by Alexander Nowak on Unsplash
Bitcoin saw a notable overnight upswing that allowed it to rally past the heavy resistance that had previously been established around $9,200.
The break above this level has led investors to become increasingly bullish as it grows ever more likely that BTC is about to start forming another leg up.
It is important to note that there are two major levels that the crypto is approaching that could provide it with some serious resistance, however.
Bitcoin fast approaching multi-year trendline as strength mounts
At the time of writing, Bitcoin is trading up just under 5 percent at its current price of $9,300, marking a notable upswing from daily lows of $8,700 that were set during its bout of consolidation seen yesterday.
Today’s movement past the heavy resistance that Bitcoin previously faced at $9,200 marks a bullish resolution to the nearly week-long bout of rangebound trading that the benchmark cryptocurrency was previously caught within.
In order for this momentum to extend in the days and weeks ahead, it is imperative that buyers flip this previous resistance into strong support.
One factor that could provide Bitcoin with some major near-term volatility is how it responds to a long-established descending trendline that it has been stuck beneath since June of last year.
A popular crypto trader on Twitter who goes by the moniker “Pentoshi” spoke about the importance of this trendline in a recent tweet, explaining that a break above it could send BTC up towards $10,500.
“BTC just tested the downtrend line dating back to June of last year. The 2019 highs. Break it and I think we see 10.2-10.5k, reject and I believe we see 8.4k.”
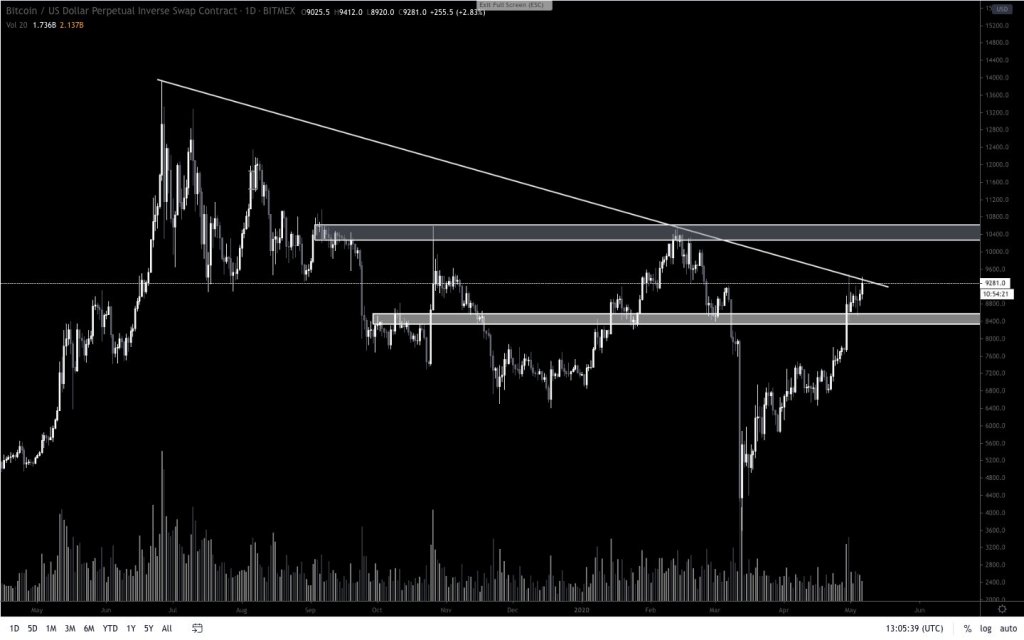
If there is an upside break of this level and BTC rallies past $10,000, this will mark a full erasure of the losses that came about as a result of the crypto’s downturn seen from late-February to mid-March.
Analysis of BTC wallets suggests heavy resistance sits between $9,500 and $9,700
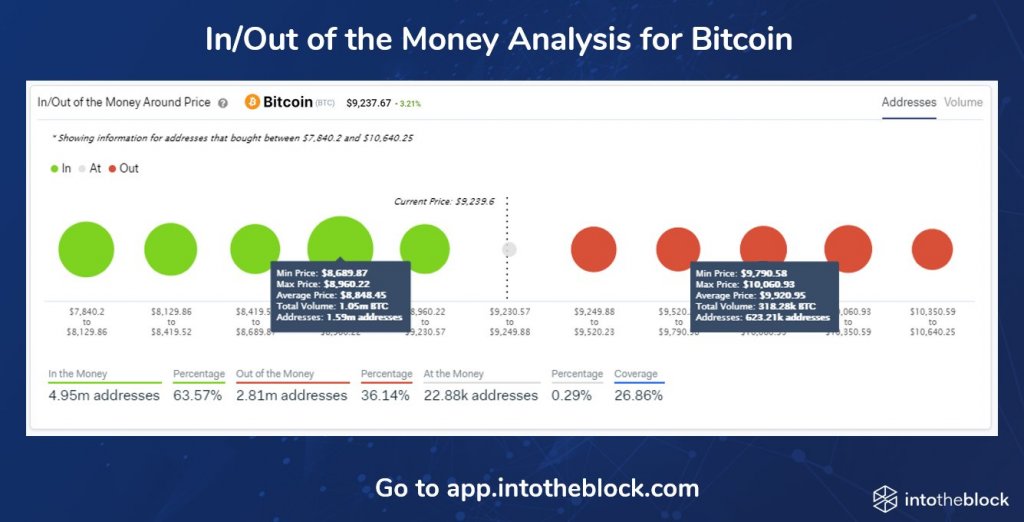
Data regarding the profitability of Bitcoin wallets at different price levels suggests that BTC may face some unforeseen resistance in the region between $9,500 and $9,700.
Blockchain analytics platform IntoTheBlock spoke about this resistance while referencing their In/Out of the Money Around Price (IOMAP) indicator, saying:
“Bitcoin is back at $9,200 again and using our (IOMAP) indicator, we see that the largest level of resistance is between $9,500 and $9,700, where 515 thousand addresses are holding 452.73 thousand Bitcoins.”
It is possible that a confirmed break above the year-long trendline that BTC is currently testing will be enough to help the cryptocurrency surmount the potential resistance within this price region.
Mentioned in this article

Latest Bitcoin Stories


You might also enjoy...


Latest Press Releases


In this article
Bitcoin, a decentralized currency that defies the sway of central banks or administrators, transacts electronically, circumventing intermediaries via a peer-to-peer network.
IntoTheBlock
IntoTheBlock is a data science company applying cutting-edge research in AI to deliver actionable intelligence for the crypto market.